

Close menu
- Home
- Ask HSJ
- Sectors
- Topics
- Local
- Comment
- Interactive
- Events
- Jobs
- All Products
- Subscribe

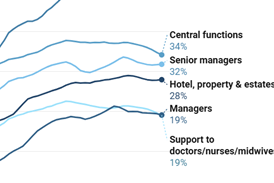


Elective waits settle into steady deterioration
By  Rob Findlay2021-10-15T10:23:00

The temporary effects of the first covid shutdown have fed through, and waiting times are now on an upward trend.
Register with hsj.co.uk to read the rest of this article

Critical stories remain free for registered users
Certain articles and Insight pieces remain paying-subscriber only content
As a registered user you will get access to:
- Daily News: an essential email round-up of all the latest news, comment and best practice
- Breaking news headlines delivered directly to your inbox
- Limited access to hsj.co.uk
Already registered to HSJ? Sign in now
Part of HSJ Information Ltd. 5th Floor, Aldgate Tower, 2 Leman Street, London E1 8FA. Registered in England and Wales. Company registration 2530185
Site powered by Webvision Cloud