


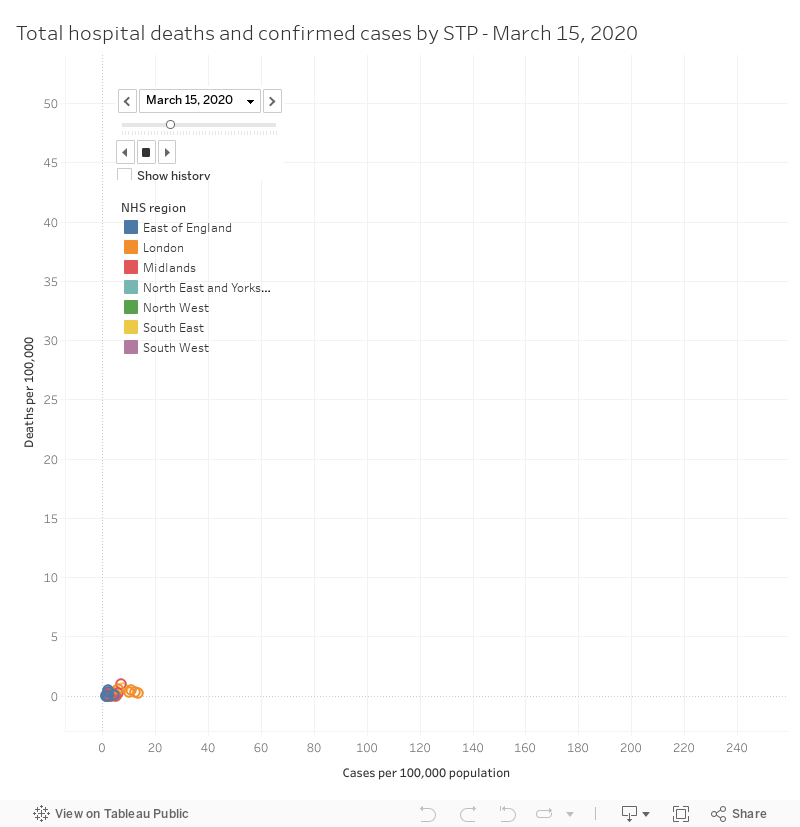
This animated chart shows the spread of covid-19 cases and deaths through different areas of England, taking account of the size of their population.
Each blob represents a part of England, a sustainability and transformation partnership.
Press the “play forward” arrow to start the animation. Hover the mouse pointer over blobs to see details
These charts are not designed for mobiles.
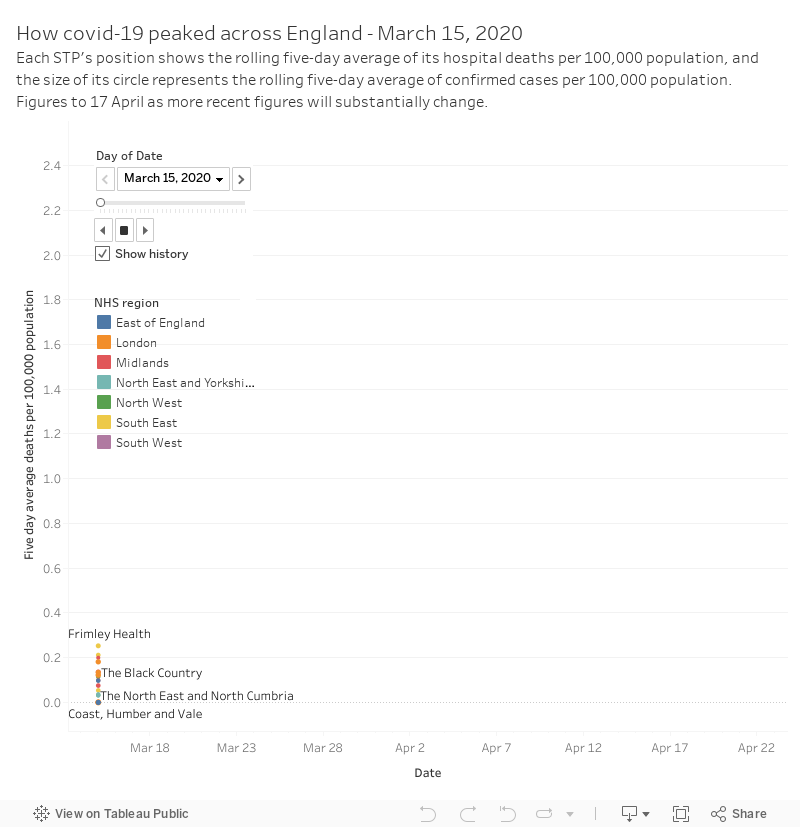
The presence of the orange markers near the top of the chart until mid April show the high mortality in London through much of the outbreak. However in recent days, the highest markers are red (Birmingham and Solihull, and the Black Country, in the Midlands) and green (Greater Manchester and Cheshire and Merseyside, in the South West).
Hospital deaths falling at fastest rate yet

Deaths from covid-19 in England’s hospitals are declining at the fastest rate yet, as the whole South West region sees one death in seven days.
- 1
- 2
 Currently
reading
Currently
reading
Coronavirus deaths by STP


10 Readers' comments