


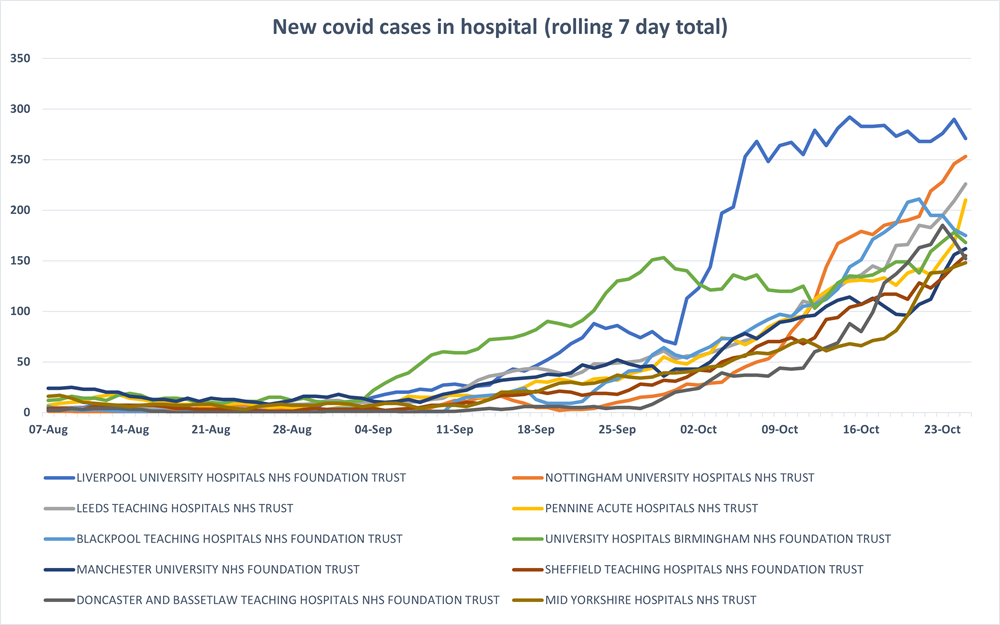
- Greater Manchester and West Yorkshire now seeing the highest numbers of new coronavirus cases in hospital
- New cases at the early-hit Liverpool University Hospitals FT have flattened in the last three weeks
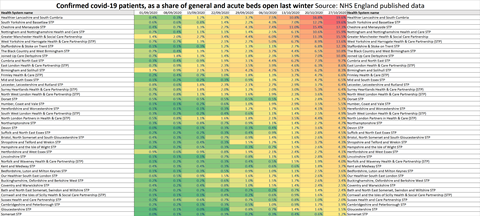
- Tables with new data for every health system and trust
Greater Manchester and West Yorkshire are now seeing the highest numbers of new coronavirus cases in hospital, while Cheshire and Merseyside – hit early in the second wave — has seen a drop in new cases in recent days.
The drop in Cheshire and Merseyside has been helped by a flattening of new cases at Liverpool University Hospitals Foundation Trust, which saw a steep rise in new covid cases at the start of October. Liverpool was made subject to stricter lockdown measures before other areas this autumn, although the apparent flattening of admissions pre-dates the formal introduction of tier 3 restrictions on 14 October.
Greater Manchester and West Yorkshire, which have both seen trusts cancelling routine elective procedures in recent days, have both had surges in new covid cases, while Cumbria and the North East is also rising fast.
Meanwhile, Lancashire and South Cumbria is now the system with the highest proportion of its beds occupied by covid-positive patients. This is based on exclusive analysis by HSJ of new data just published by NHS England.
The high occupancy in Lancashire is driven particularly by Blackpool Teaching Hospitals FT, which is the first trust in the second wave to have more than 30 per cent of its beds occupied by covid-positive pateints.
TO READ THE CHARTS:
Kevin McGee, Blackpool FT’s chief executive, told HSJ: “We are managing the situation daily. There have been some cancellations to manage operational capacity which is normal but there are no systematic changes at this point.”
South Yorkshire, West Yorkshire, and Nottinghamshire — where trusts have also moved to cancel electives over the last fortnight — have seen substantial increases in the share of their hospital beds occupied by covid patients in the week to Tuesday 27 October: 7, 5 and 5 percentage points respectively.
In several cases the covid occupancy is now higher than it was for these areas in the first wave.
The charts are built with new weekly hospital activity data published by NHS England, covering a period from early August to 25 October.
2020 HSJ Patient Safety Virtual Congress and Awards
The Patient Safety Virtual Congress brings together over 1000 attendees with the shared goal of pushing the boundaries of patient safety in the UK. Hear from patient advocates on an equal platform and leave with practical ideas to take back to your organisation.
Register your interestSource
NHS England data
Source Date
29 October 2020
Liverpool admissions flatten as covid accelerates in Manchester, Yorkshire and Notts
Greater Manchester and West Yorkshire are now seeing the highest numbers of new coronavirus cases in hospital, while Liverpool Cheshire and Merseyside – hit early in the second wave — has seen a drop in new cases in recent days.
 Currently
reading
Currently
reading
Liverpool admissions flatten as covid accelerates in Manchester, Yorkshire and Notts
- 2
- 3


6 Readers' comments