


Despite conflicting data, Robert Thorp and Jonathan Pearson believe economies of scale do exist in the NHS. So how do we reap the benefits?
The NHS needs to make unprecedented efficiency savings of £20bn. In this context, consultant Finnamore has carried out analysis of published NHS data to identify to what extent there is empirical evidence of economies of scale in the health service.
The chart below shows an analysis of 2010-11 reference cost data for England, by organisation and by currency (healthcare resource group or other activity measure for non-HRG areas) for elective inpatient activity. Each dot therefore represents a combination of an organisation and a type of activity. For example, the highlighted data point represents HRG HB21C at Robert Jones and Agnes Hunt Orthopaedic and District Hospital Trust.
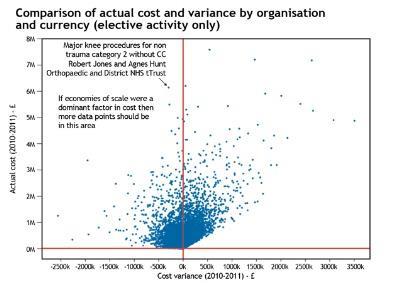
The two axes on the chart are actual cost, as submitted in reference costs, and the variance from “expected cost” (which is the mean cost for that currency item in England). A negative variance shows that for that HRG (or other currency measure), an organisation is less expensive than the mean. A positive variance shows that the organisation is more expensive than the mean for that type of activity.
‘Large organisations still have opportunities to secure economies of scale through their quality, innovation, productivity and prevention programmes’
If economies of scale existed and are the dominant driver of costs, then we would expect to see a trend of increasing negative variances as actual cost (and therefore activity) increases.
It can be seen from the graph that no such clear pattern emerges, which suggests that economies of scale, if they do exist, are not the dominant driver of cost differentials between organisations at a HRG, or equivalent, level.
The graph shows more evidence of diseconomies of scale than economies of scale. However, it may be that variations in overhead apportionment could be creating “noise” that is disguising economies of scale that exist at an organisational level.
The next chart compares actual costs with cost variance at an organisation level. The blue dots show the actual cost of each organisation, the red dots show the variance from expected cost at an organisational level.
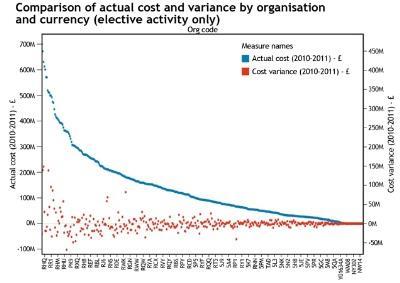
It can be seen again that the distribution of red dots appears essentially random, suggesting again that economies of scale are not the dominant driver of cost differences between organisations. In other words, larger organisations have not secured economic benefits of size and many have higher than expected costs.
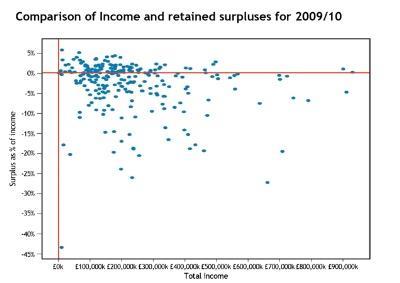
We also carried out analysis of 2009/10 annual accounts information for all NHS trusts and foundation trusts in England. This again sought to look for evidence of economies of scale at an organisation level by comparing total income with retained surplus as a percentage of total income.
If economies of scale are dominant then we would expect there to be a trend between increasing income (as a proxy for scale) and retained surpluses. From the next chart, below, it can be seen that no such trend is apparent.
Findings from data analysis
These three analytical reviews combine to suggest economies of scale are not the dominant driver of cost and financial performance differences between trusts. Instead, the data implies that other factors have greater influence on performance, such as demographic differences, different levels of efficiency, organisational capability and culture, as well as the relative level of local competition.
Despite this analysis, however, Finnamore’s own experience of working with trusts is that economies of scale do exist, and that benefits can be achieved by increasing scale. These benefits therefore appear to be masked in the published data by other factors. In seeking to understand where key economies of scale do exist in the NHS, we have identified two core areas:
- cover arrangements;
- improved utilisation.
Cover arrangements
Arrangements for medical and other clinical cover (eg radiographers) are expensive, and with pressure on junior doctor training places in the future, these arrangements are likely to become more expensive still. Medical cover needs to be provided, regardless of whether it is used. A reduction in the number of sites where emergency cover is required can generate savings of several million pounds. Finnamore’s recent experience of acute service reviews indicates that savings in the order of £3-5m may be realisable for large multi-site trusts.
Improved utilisation
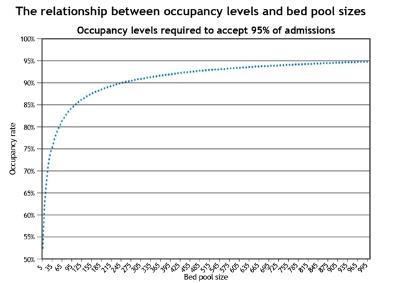
There is a natural variation in the flow of emergency admissions. Analysis indicates that these have a tendency to follow the poisson distribution. This makes it possible to model occupancy rates required to ensure 95 per cent of admissions can be accepted. The underlying logic is that bigger bed pools allow hospitals to run with higher occupancy rates than those with smaller bed pools.
It can be seen from the final chart, above, that increasing a bed pool from 105 to 245 allows mean occupancy to increase from 85 per cent to 90 per cent while still ensuring that 95 per cent of admissions can be accepted. This allows for better use of resources through scale.
Our analysis of published NHS data shows that the empirical evidence of economies of scale in the health service in England is weak.
On a positive note, this may suggest that large organisations still have opportunities to secure economies of scale through their quality, innovation, productivity and prevention programmes. We have suggested two specific areas where economies of scale could be obtained.
Equally, one could argue from these analyses that large NHS organisations can suffer from diseconomies of scale and that size is not necessarily the answer to financial viability. This is likely to be of interest to trusts contemplating merger and underlines the importance of:
- being very clear and specific about the benefits of merger;
- how the benefits outweigh the costs of merger and diseconomies of scale of the enlarged organisation;
- how the benefits will be delivered. This is also likely to be of interest to the regulators controlling mergers.
Finally, it suggests small and medium sized organisations that are efficient, competitive and focused can have lower costs than larger organisations.
Robert Thorp is a principal consultant and Jonathan Pearson is a director with Finnamore


2 Readers' comments