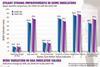
The NHS Better Care, Better Value indicators are designed to help organisations spot opportunities for improving productivity and efficiency.

DB_graph_quality_and_value.jpg

DB_graph_quality_and_value.jpg

They can also give some insight as to what is happening across the country as the NHS continues its drive to improve the quality and value of care.

The first chart shows the overall change in the indicators’ national upper quartile level of performance from the start of 2006-07 to the end of 2007-08. Trusts and primary care trusts have delivered steady strong improvements in some indicators such as day case rate (up 10 points to 79 per cent) and low cost statins (also up 10 points). In other areas where change is more complex and involves more stakeholders, such as the level of surgical thresholds, there has also been an impressive 5 per cent improvement over two years (a fall in the indicator value means a lower level of ineffective interventions). For a typical trust a half percentage point cut equates to about five beds.

So who is making these improvements? Around two thirds of trusts have improved their performance on pre-operative stays and day case rates whereas only 25 per cent have made significant cuts to overall length of stay, showing perhaps that the area with the biggest opportunity is also the most difficult to achieve (see table, second chart). All but two PCTs have improved their rate of low-cost statin prescribing but only 40 per cent have reduced the level of ineffective surgical interventions. The second chart also shows how the average indicator values have changed by strategic health authority.

Outpatient indicators

To further help clinicians and managers decide how to improve services, the success to date is being built on with the addition of new indicators. We will shortly publish indicators for outpatients who did not attend; outpatients new to follow-up appointment ratio; and elective and emergency 14-day readmission rates.

These will be followed by new prescribing indicators covering low-cost proton pump inhibitors, ACE inhibitors and generic drugs.

The third chart shows the new indicators reveal an annualised£500m productivity opportunity based on all organisations moving to upper quartile performance. This is in addition to the£2bn opportunity still remaining from the original indictors.

Full figures on all of the Better Care, Better Value indicators can be found at www.productivity.nhs.uk