


The rise in one year waiters has accelerated, with most of these ultra long waiters highly concentrated in a small number of providers, warns Rob Findlay

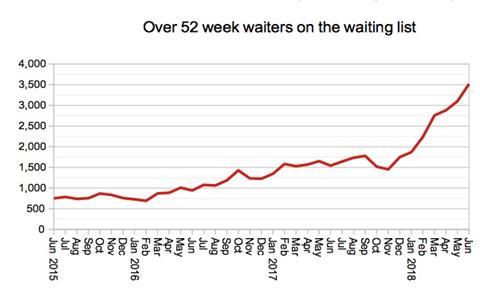
The number of one year waiters in England shot up by 13 per cent in June – a bigger increase than the previous two months combined. The number now stands at 3,517 which is the most in over six years.
According to the current planning guidance, the number of one year waiters should halve over the course of this financial year to below 1,378. Instead they are heading in the wrong direction, and have risen by 28 per cent in the first quarter alone.
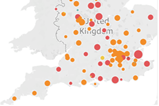
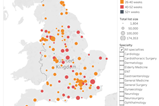
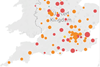
These ultra long waiters are very unevenly distributed, with just seven trusts holding a majority of them. Across England, 28 per cent are waiting for orthopaedics, with a further 18 per cent for general surgery, and 12 per cent falling under “other” specialties (which includes some services that have recently split out from general surgery as well as specialties such as paediatrics). The other specialty worth mentioning is gynaecology, where there are 341 one year waiters of whom some 86 per cent are waiting at just two trusts.
In the following discussion, all figures come from NHS England. If you have a national statistic that you’d like to check up on, you can download our RTT waiting times fact checker.
England wide picture
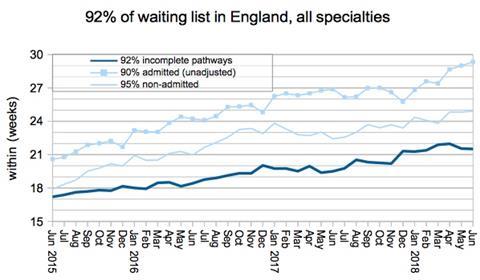
Waiting times were steady overall, as the NHS used its summer capacity to treat long waiting patients.
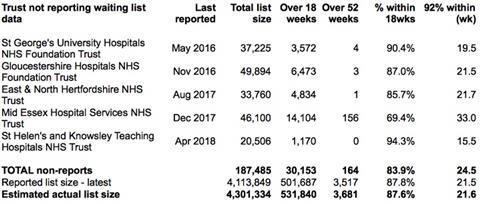
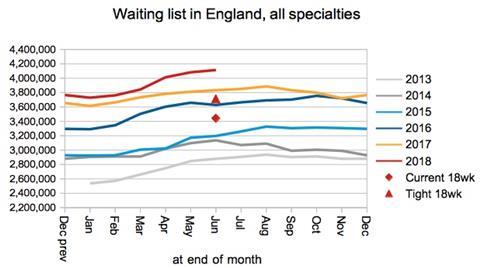
If the last known positions at non-reporting trusts are added back in, the waiting list stood at 4.3 million patients at the end of June which is the largest number since referral to treatment records began in 2007.
Returning to the reported figures, the number of patients on the waiting list (which is the main driver of waiting times) climbed towards its seasonal peak for the year.
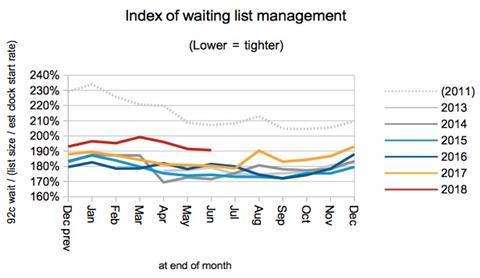
The index of waiting list management (which bundles up the other drivers of waiting times) improved seasonally to counterbalance the rising waiting list, but this indicator continues to run at a looser level than in recent years.
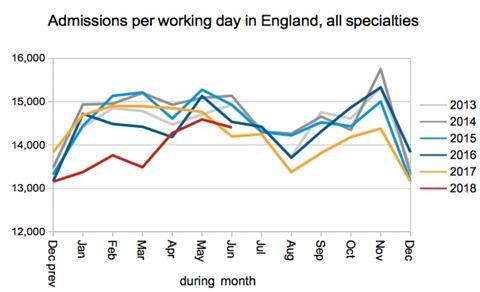
Admissions from the waiting list during the first quarter of the financial year were broadly in line with recent years, after an exceptionally depressed performance over winter.
The most spectacular change is in the number of one year waiters, which has been rising sharply since December and shows no sign of recovery following the end of winter. As noted above, a majority of these ultra long waiters are highly concentrated in a small number of providers.
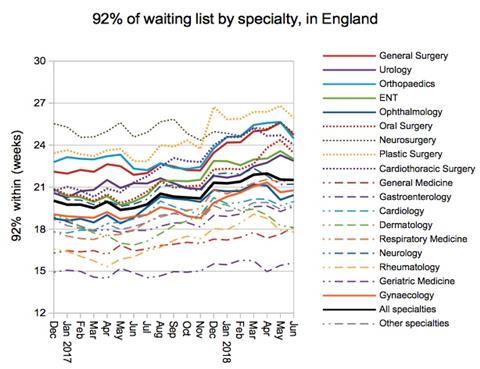
Looking at waiting times at specialty level, general medicine finally tipped over into 18 week breach during June, leaving only two specialties (rheumatology and geriatric medicine) achieving the 18 week standard at national level.
Local detail
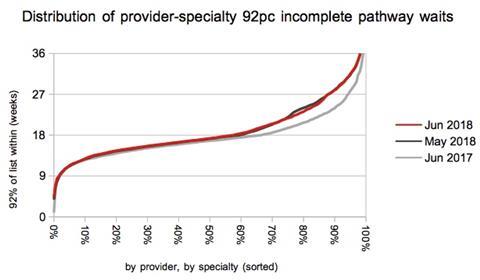
The proportion of local services achieving the 18 week standard edged down a little, to 57.6 per cent of the 2,559 services that have significant waiting lists.
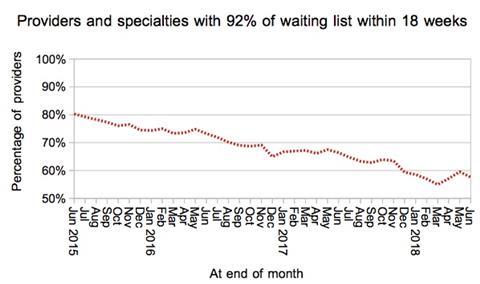
Nearly all of the deterioration over the last year has been at the longer waiting end of the distribution of local waiting times, which is consistent with the rapidly worsening position on one year waiting times.
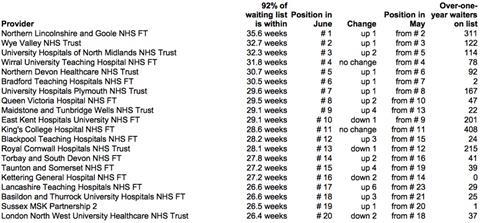
Turning now to the table of longest waiting providers, the main change is that everybody has shuffled up a bit, following the sudden disappearance of City Health Care Partnership Community Interest Company who had topped the table for the entire previous year. This provider reduced its waiting times from 37 weeks all the way to 20 weeks during June, and dropped out of sight from 1st to 78th position in the table.
Referral to treatment data for July 2018 is due out at 9:30am on Thursday, 13th September.
Downloads
RTT waiting times fact checker
Excel, Size 0.16 mb


No comments yet