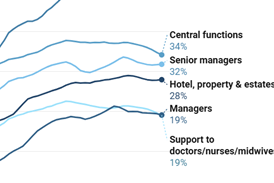
• Eight in 10 trusts more likely to appoint white applicants compared to candidates from minority ethnic backgrounds
  • Midlands has “progressively deteriorated” while the North West has seen “marked deterioration”
  • Staff from minority ethnic backgrounds were 1.25 times more likely to enter formal disciplinary processes at more than half of trusts

Eight in 10 trusts are significantly more likely to appoint white applicants than applicants from minority ethnic backgrounds after shortlisting, new NHS England data has revealed.

The latest data, from the 2024 NHS Workforce Race Equality Standard (WRES) report, which covers the 12 months to March 2024, reveals this metric applied at 80 per cent of trusts.

It has worsened from the previous year (76 per cent) and the year before that (71 per cent). 

While the London region has seen year-on-year improvement in this area, NHS England said it has “progressively deteriorated in the Midlands,” while there has been a “marked deterioration” in the North West (see table below).

The report said: “Recruitment from interview remains the most difficult to change metric, with the national likelihood ratio remaining broadly unchanged since the inception of the WRES in 2016.”

Region202220232024
East of England 1.96 1.46 1.8
London 1.43 1.47 1.16
Midlands 1.46 1.5 1.71
North East & Yorkshire 1.81 2.01 1.74
North West 1.62 1.58 2.01
South East 1.3 1.63 1.53
South West 1.82 1.78 1.93

(Table 1: Regional breakdown of the relative likelihood of white applicants being appointed from shortlists compared to candidates from minority ethnic backgrounds)

The relative likelihood of minority ethnic staff entering formal disciplinary processes compared to white staff has also worsened.

According to NHSE, just over half (51 per cent) of trusts reported that these staff were 1.25 times more likely to enter these processes than their white colleagues.

London remains an outlier, where staff are 1.5 times more likely, but the South East has deteriorated significantly from 1.04 in 2023 to 1.44 the following year (see table below).

Region202220232024
East of England 1.11 0.92 1.07
London 1.47 1.41 1.5
Midlands 1.01 0.99 1.07
North East & Yorkshire 1.07 0.94 1.07
North West 1.2 1.11 0.9
South East 1.14 1.04 1.44
South West 1.28 1.06 1.04

(Table 2: Regional breakdown of the relative likelihood of staff entering disciplinary processes compared to white staff)

However, while the national indicator has worsened slightly since last year (1.03), it has still improved from 1.56 in 2016, when the WRES was first published.

It comes as the proportion of minority ethnic trust staff in the NHS has grown 11 per cent since 2016, rising from 17.7 per cent to 28.6 per cent across an eight-year period.

NHSE data shows there were 198,719 more ethnic minority staff 2024 compared to 2018, equating to an 84 per cent increase. The number of white staff rose by 75,714, or by 8 per cent, across the same period.

London has the highest percentage of minority ethnic staff (53 per cent), followed by the East of England (29.9 per cent) and the South East (28.5 per cent), while the South West has the lowest (17.3 per cent).

The report said: “All regions saw significant increases in the percentages of [Black and minority ethnic] staff between March 2023 and 2024, probably reflecting (at least in part) changes in the demographic profile of the working age population.”

Meanwhile, the number of very senior managers from minority ethnic backgrounds has increased from 201 in 2018 to 372, an 84 per cent increase and its highest level since the inception of the WRES.

However, while board-level representation has reached 16.5 per cent, this has not kept up with the rise in minority ethnic staff across the wider trust workforce.

Picture4

Graph 1: The gap between percentage of minority ethnic representation on trust boards and percentage of minority ethnic representation in NHS trust workforces, from March 2021 to 2024 (source: 2024 WRES report)

The report noted the gap between board-level representation and workforce representation had increased from 9.7 per cent in 2021 to 12.2 per cent last year.

It added: “The gap among executive board members, at 16.8 per cent, was especially large in 2024, having increased from 13.5 per cent in 2021.”

Its conclusion said: “The reductions in the levels of harassment, bullying, and abuse from the public and by staff, coupled with the increasing confidence of BME staff in their opportunities for career progression, are significant achievements that reflect our commitment to fostering a fairer and more inclusive environment.

“However, the findings also remind us that the journey towards achieving full race equality is ongoing.”