


New tools can engage stakeholders with robust evidence to help them make more informed choices on resource allocation. By Helen Crisp

Despite a large variety of tools and techniques for resource allocation being available, their adoption has been somewhat limited. Some of these tools and techniques assist in investigating variations in patterns of spend or activity. Others link expenditure and health outcomes, while few allow testing of different mixes of treatment methods for specific disease. All have limitations.
Methods such as cost per quality adjusted life year (QALY) are theoretically sound and evidence based but can be difficult to grasp for those without an understanding of health economics, making them unsuitable as a basis for meaningful engagement with stakeholders.
‘Failure to constructively involve stakeholders in decisions about allocation of healthcare services can create no end of difficulties’
Other tools that are easier to understand tend not to draw on robust theory systematically. Research suggests that despite a large variety of tools and techniques on offer, their adoption has been limited. Where tools are used, it is often restricted to decisions at the margin rather than prioritising existing expenditure.
Failure to constructively involve stakeholders in decisions about allocation of healthcare services can create no end of difficulties. The Health Foundation and the London School of Economics and Political Science have come up with a new approach to priority setting for commissioners, which combines value for money analysis with stakeholder engagement.
Shining star
The “Star” tool, which stands for social-technical allocation of resources, is designed to help healthcare commissioners and planners pinpoint where they may be able to get additional value from their resources by using them more effectively − the holy grail.
It was developed as a result of LSE research into how a health economist’s view could improve the quality and value of healthcare. The research identified a need for new practical techniques capable of assessing comparative values in healthcare.
‘A key element of the task was to make stakeholders confront an untenable situation and win their support for changes’
What makes the approach distinctive is its presentation of whole picture data, including the knowledge and experience of patients, clinicians and other stakeholders who help gauge the relative benefits of various interventions on a consistent basis.
It enables commissioners and providers to focus on reducing spending where total costs are high but total benefits are low, and increasing spending on activities that produce high value at low cost.
NHS Sheffield pilot
NHS Sheffield piloted the free tool prior to the introduction of its clinical commissioning group. NHS Sheffield wanted to see if it could help with priority setting around the reallocation of resources within existing activities, rather than deciding how best to distribute additional funds. They wanted to tackle those hard choices that can often lead to disinvestment.
NHS Sheffield chose the area of mental health, honing in on their eating disorder services and related interventions. They suspected that certain areas of spending on the service were not good value for money but had been unable to produce an analysis that supported this.
‘The organisation managed to take its stakeholders with it on this journey by inviting them into a process, which created a participatory atmosphere’
The ambition was to create a commissioning strategy that would safeguard interventions offering relatively high value for money, while re-examining spending on those that offered relatively low value for money. A key element of the task was to make stakeholders confront an untenable situation and win their support for changes in the way resources were targeted, helping NHS Sheffield to justify and gain buy in for the decisions it had to make.
To start the “decision conference”, local available data is fed into the Star programme on the costs, numbers and types of people benefiting from a particular service and any evidence of health gain. Inevitably there will be gaps in the data, especially for health gain − a common problem throughout the NHS.
Therefore the decision conference’s first task is usually to generate this missing data; they look at the data available, create intervention profiles and then use value judgements to assess their benefits. The software then uses that data to produce three types of simple visual aids (see charts, left).
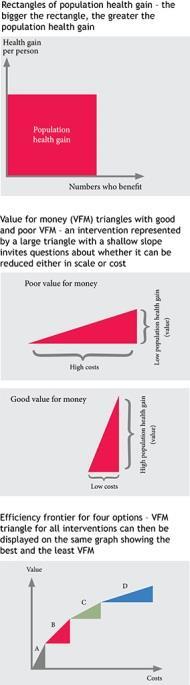
After using each of these visual aids in turn, commissioners have transparent results, representing best local knowledge, on which to make investment and disinvestment decisions. The visual geometry represents real life trade offs, so it helps clarify decisions and ensures that stakeholders are familiar with the reasoning behind the need for change.
The decision conference
NHS Sheffield and the LSE team organised a two day decision conference led by a trained facilitator. It involved 25 stakeholders, including service users, clinicians and managers from all the local providers of eating disorder services, as well as GPs and representatives from the voluntary sector and the local authority.
The conference looked at seven interventions and used the group’s knowledge and experience to make reasoned judgements on the lived experience of people with three different severities of eating disorder: mild, moderate and severe.
They then assigned a weighting for the quality of life of an average person with a given disease severity, mapping this visually by estimating what impact each eating disorder intervention would have on a patient’s quality of life.
The group calculated the proportion of patients whose condition would deteriorate, stay the same or to varying degrees recover and the resulting average quality of life. Then each intervention was ranked according to its value for money.
At the end of this exercise it was discovered that 90 per cent of the spending on eating disorder care generated only a small population health gain.
Lessons learned
NHS Sheffield demonstrated how it could achieve savings on their inpatient services for eating disorders by shifting its current investment patterns to where they added most value.
The organisation managed to take its stakeholders with it on this journey by inviting them into a process, which created a participatory atmosphere providing key insights into service provision at every level. Experience has shown that those without knowledge of health economics are able to grasp the ideas behind resource allocation helped by Star’s visual geometry.
The tool enables commissioners, planners and others to use the approach and generate graphs that display comparative costs and health outcomes.
Find out more
Helen Crisp is assistant director at the Health Foundation


1 Readers' comment