


The waiting list grew, waiting times went up, and so did the risk of an 18 week national breach. Ground gained before the general election is slipping away
Elective waiting lists and waiting times grew again in July, according to the latest figures for England, though waiting times remained within the 18 week target at national level.
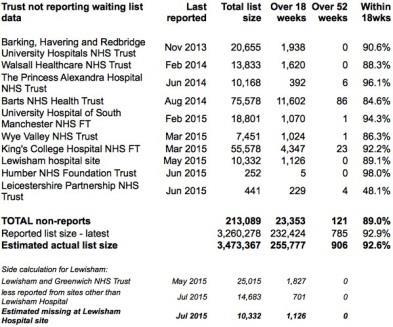
At nearly 3.3 million patients – nearly 3.5 million if you include estimates for non-reporting trusts – the waiting list was the largest since January 2008.
‘The waiting list is the largest since January 2008’
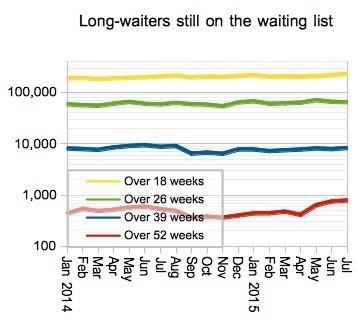
Similarly, the number of one year waiters reached 785 (or 906 including non-reporters), which is around quadruple the record best of 214 that was set 20 months before.
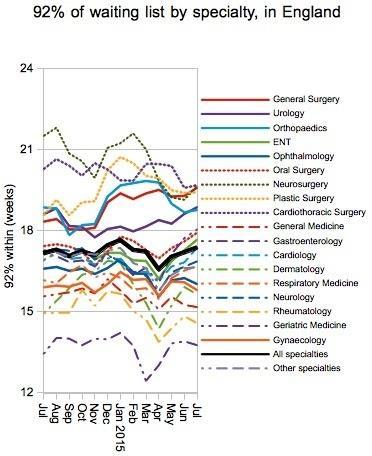
Waiting times deteriorated sharply in general surgery and urology that were already breaching 18 weeks at national level, and also in ear, nose and throat, which is also now rapidly approaching a national breach.
In the following analysis, all figures come from NHS England. If you have a national statistic that you would like to check, download our Gooroo NHS waiting times fact checker.
- 18 week waits, July 2015: explore the maps
- Dear health secretary: Here’s what you should do about waiting times
- Clever patient scheduling won’t prevent a waiting list breach
The big picture
July was the first full month since the perverse targets for admitted and non-admitted patients were rightly scrapped, so an improvement in patient scheduling – and therefore long waits – might have been expected.
However, the growing waiting list is reversing those gains, and if it keeps on growing faster than demand, it is only a matter of time before the 18 weeks target is breached at national level.
What happened in July is that long waits crept up again, with 92 per cent of the waiting list reaching 17.4 weeks, up from 17.2 weeks in June.
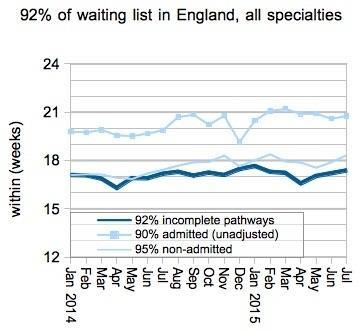
So waiting times are closing in on the 18 week breach level, and the ground gained before the general election is slipping away.
Two more hospitals joined the list of trusts that are not reporting their waiting list data, and none started reporting again. So the new and tougher approach to non-reporting has not so far had any noticeable effect.
It is usual for the waiting list to grow at this time of year, reaching a seasonal peak in July or August before shrinking again over the autumn. If that shrinkage happens this year then we can all cheer. But if it doesn’t, like in 2013, then we’re in trouble.
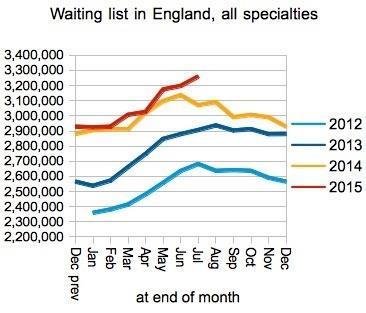
But trouble is not inevitable, just as this year’s July growth of 62,345 patients is far from unprecedented. In July 2010 the list grew by 87,516 patients and then shrank away nicely over the autumn.
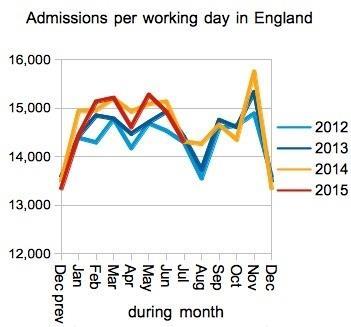
Demand is up, but admissions per working day remain stubbornly flat. No wonder the waiting list is growing.
‘In November 2013 the English NHS was tantalisingly close to eliminating one year waiters’
Back in November 2013 the English NHS was tantalisingly close to eliminating one year waiters, with only 214 remaining on the waiting list.
In the latest figures there were 785 (or 906 if you add back in the last reported position at non-reporting trusts) and it is a real shame to see this going off in the wrong direction.
Long waiting specialties got worse, gastroenterology started breaching, and ear, nose and throat is racing towards breach territory too.
The proportion of local services (specialties within trusts) achieving 18 weeks declined modestly.
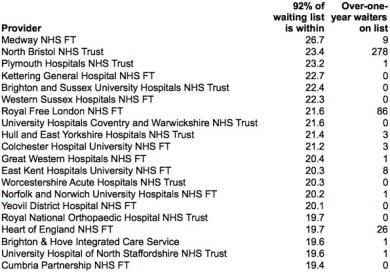
One trust did drop out of the table, but it’s a sign of the times that even at 28th place they can still have 18.5 week waits, so congratulations would perhaps be premature.
Data for August is due out on 8 October.


No comments yet