


In the final article in the Lessons from India series, Jo Bibby reports about the improvement measures and innovative use of data by providers in the country
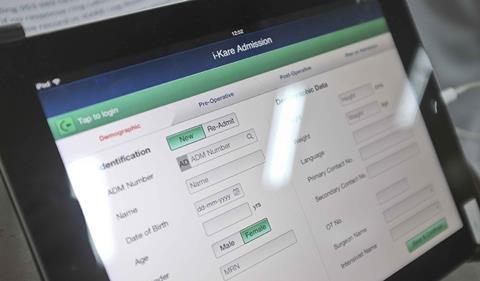
An iPad was at the end of each bed at Narayana Health, allowing records to be updated and viewed real time
Given the methods supporting improvement are not a mystery – know your process, standardise for reliability, embed measurement and use feedback – coming across anything new is unusual.
This applied to the systems we visited. The presentations were arguably no different to what I see in the UK.
Sophicated standardisation
Yet there was a difference in the positioning of improvement in the organisation and the sophistication with which the principles were applied.
For the mission orientated chief executives we met, quality improvement was not an add on, it was the delivery model.
‘Where evidence exists, it is adopted. There is rigorous emphasis on measurement’
The focus on standardisation was relentless, but at Narayana Health the sophisticated feedback ensured that it did not constrain innovation.
It was accepted that, at times, it will be necessary to deviate from protocols to get better outcomes.
Deviations are reviewed so that, where advantage is shown, the standard protocol can be changed.
- Lessons from India: the role of tech and compassionate clinical leadership
- Lessons from India: using patient data in real time
In the UK the absence of clear evidence often becomes a barrier to agreeing standard processes. The Indian healthcare system seems to have sidestepped this issue.
Where evidence exists, it is adopted. Where evidence is uncertain, the drive for efficiency becomes the determining factor in creating a standard process.
‘This was not about data for external display, it was data for internal learning and improvement’
This might be concerning if it were not for the rigorous emphasis on measurement.
At LV Prasad Eye Institute everyone is encouraged to take responsibility for the quality of the care, from security guards to surgeons.
Data is routinely collected against 64 metrics and run charts are reviewed regularly to identify any trends and areas for improvement.
I was struck by a real moment of authenticity when their head of quality presented run charts showing their unplanned returns to theatre increasing and explaining the causes and the actions to get things back on track.
This was not about data for external display, it was data for internal learning and improvement.
Jo Bibby is director of strategy at the Health Foundation. Photos by John Illingworth, policy manager at the Health Foundation
Topics
Lessons from India: how to improve care with limited resources

First dispatch from senior NHS leaders’ research trip
- 1
- 2
- 3
- 4
 Currently
reading
Currently
reading
Lessons from India: 'The focus on standardisation was relentless'


No comments yet