


The waiting list isn’t shrinking much this autumn. So there is little chance of holding the waiting list steady in 2018-19, as the planning guidance intended. By Rob Findlay
The national waiting list has a clear seasonal cycle. It grows strongly in the spring. And it falls decisively in the autumn.
That’s what happens in a good year, anyway.
In a bad year, it grows in the spring and plateaus in the autumn. So at the end of a bad year the waiting list (and waiting times) end up being much longer.
2018-19 was supposed to be a good year, according to the planning guidance. But this autumn the waiting list has hardly fallen at all, which is characteristic of a financial year in which the waiting list and waiting times rise sharply.
In short, it looks like the ambition to stop the waiting list from growing this year is toast.
In the following discussion, all figures come from NHS England. If you have a national statistic that you’d like to check up on, you can download our RTT waiting times fact checker.
England-wide picture
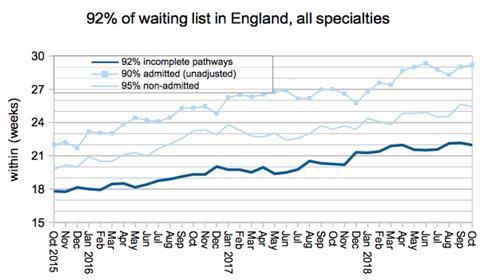
Waiting times were broadly steady in October.
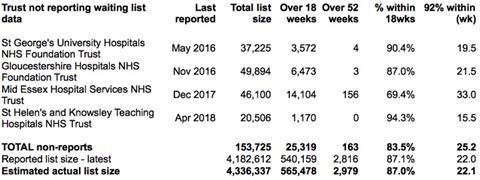
Looking at the list of non-reporting trusts, East and North Hertfordshire Trust started reporting again with a waiting list 25 per cent larger than their last reported list in August 2017.
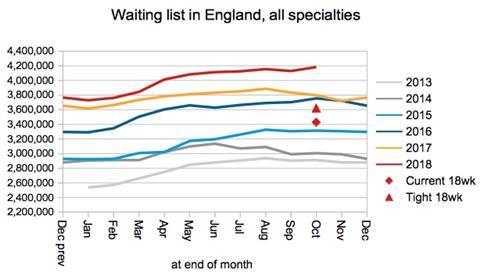
In the chart below, which is not adjusted for non-reporting trusts, we can see that the waiting list tends to grow in the spring, and either shrink (in a good year) or plateau (in a bad year) in the autumn. This year it is plateauing.
The change in list size from August to October is somewhat predictive of the change across the whole financial year, and if this year follows the same pattern then (allowing for non-reporting trusts) we can expect list growth in 2018-19 of about 230,000 patients. That is not what the planning guidance intended: it said growth should be zero.
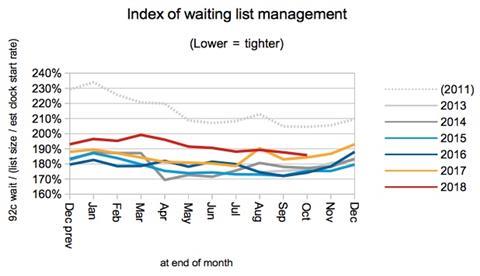
The index of waiting list management, which sweeps up all the influences on waiting times other than list size, continues to follow the pattern of last year. This is slightly looser than in previous years which may reflect the increased pressures on beds.
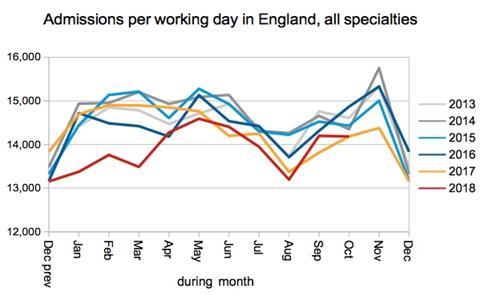
Admissions per working day continued to follow last year’s pattern, which again is below the performance of recent years.
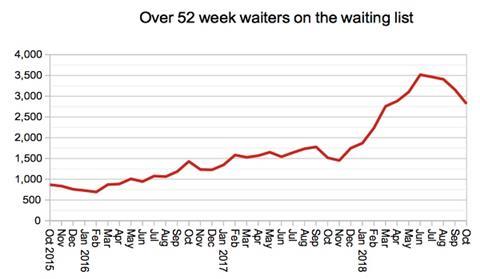
It isn’t all doom and gloom though: at least one year waiters are coming down. But they remain well above the intended level of 1,378 to be achieved in March 2019, and winter is still to come.
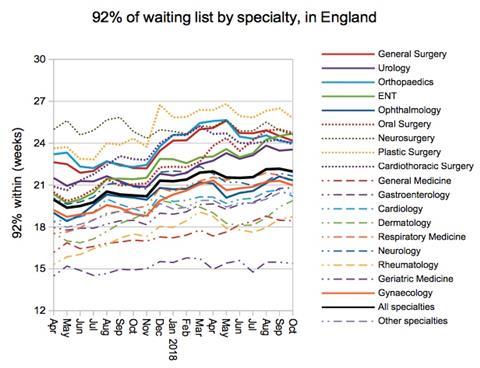
Waiting times at specialty level were broadly steady, with only Geriatric Medicine achieving the 18 week target nationally.
Local detail
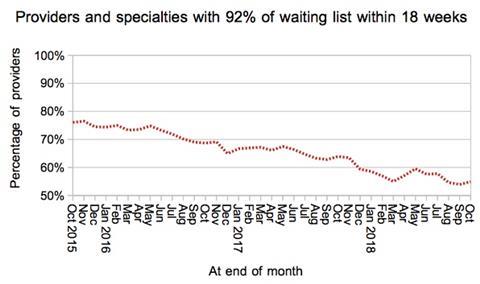
The proportion of local services (by specialty by provider) achieving 18 weeks rose slightly. But if this winter is as bad as last winter, this could drop below 50 per cent in the coming months.
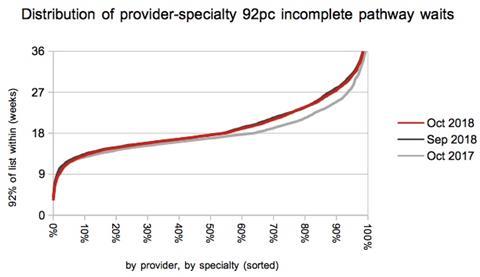
The distribution of waiting times was almost unchanged, in line with the overall national picture.
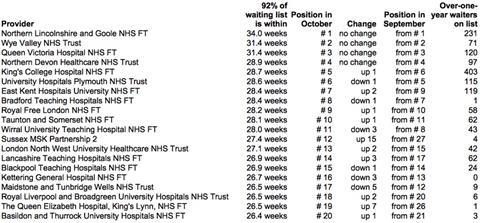
Looking at the top 20 longest-waiting providers, Northern Lincolnshire and Goole Foundation Trust topped the table again, but their waiting times eased back slightly from 34.8 to 34 weeks.
Referral-to-treatment data for November 2018 is due out at 9:30am on Thursday 10th January 2019.
Dr Rob Findlay is director of software company Gooroo Ltd, specialists in NHS demand and capacity planning.


No comments yet