


Elective admissions fell to their lowest July rate in 10 years. It wasn’t a patch on winter’s torrid slowdown though. By Rob Findlay
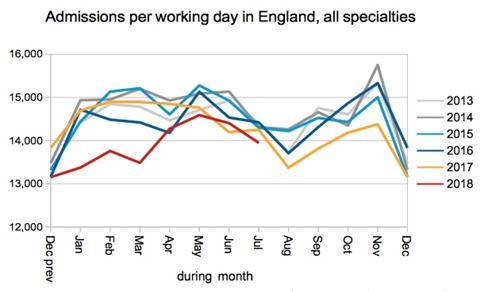
Elective admissions per working day were the lowest of any July in the last 10 years, according to the latest data released by NHS England. The fall comes after the exceptionally low admission rates of winter, and is symptomatic of the unusual pressures on NHS capacity which are contributing to a growing waiting list and lengthening waiting times.
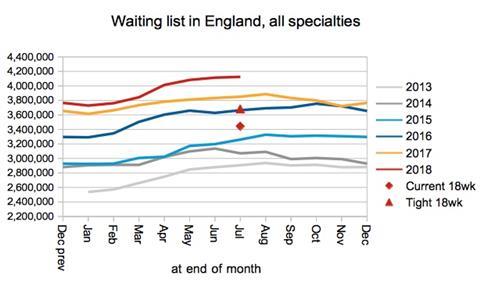
The size of the referral to treatment waiting list usually peaks around the end of July, and it looked as though it might break the record this year. But so far the reported list size remains slightly below the record, which was set in the first month of data back in August 2007. However, if non-reporting trusts are added back into the numbers, that record was broken back in April.
Records make a good headline, but it is what happens next that matters.
In a good year, the waiting list peaks in the summer and then falls back towards its seasonal low through the autumn. In bad years the waiting list plateaus, only to soar again the following spring. So if the waiting list doesn’t start falling in the September data, then there will be little chance of achieving NHS England’s aspiration to stop the list from growing in the current financial year.
In the following discussion, all figures come from NHS England. If you have a national statistic that you’d like to check up on, you can download our RTT waiting times fact checker.
England-wide picture
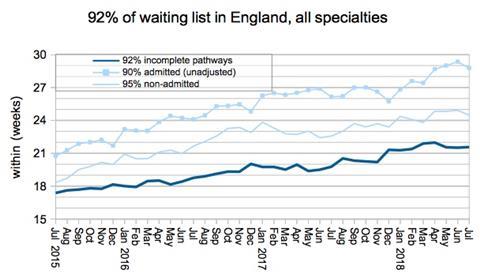
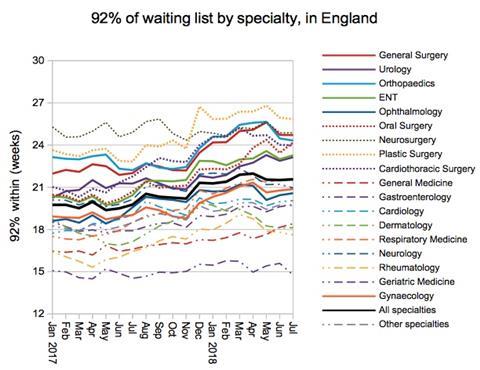
RTT waiting times were steady through the summer. But with 92 per cent of the waiting list within 21.6 weeks, national performance remains far worse than the 18 week target.
There was no change to the list of non-reporting trusts in July.
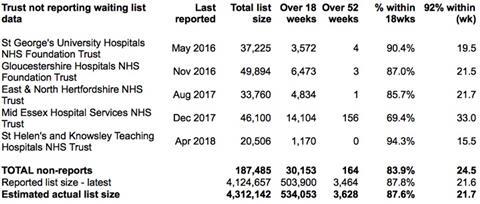
The officially reported waiting list usually peaks around this time of year, and at the end of July the reported waiting list held some 4,124,657 patients. This is slightly below the record which was set by the first ever RTT waiting list statistics back in August 2007.
But what was that record? Curiously, it depends on which official statistics you look at. The spreadsheet which accompanies the statistical press notice says it was 4,186,974 patients. But if you go back into the archives to find the original data table, it says 4,187,398. Does it matter? Not really. But it’s rare to find any inconsistency in the careful work of NHS England statisticians, and I’d be curious to know how the glitch crept in.
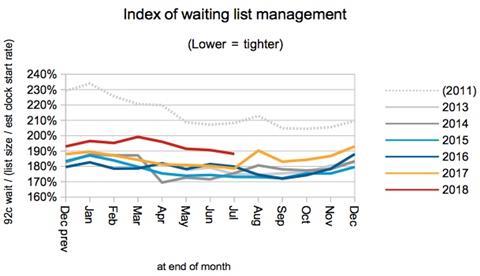
The index of waiting list management (which bundles up the causes of long waiting times other than list size) remained higher than in recent years.
Admissions from the RTT waiting list per working day were low, and this is the first time that a July admission rate has fallen below 14,000 per working day since 2008. The shortfall is not a patch on winter’s ghastly experience, though.
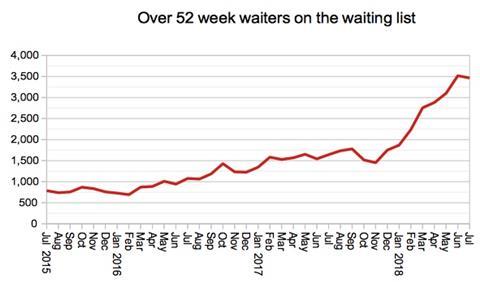
The number of one year waiters took a surprise breather from its rapid upward trajectory. But it’s anybody’s guess what will happen next – one year waits are far enough out from the main part of the waiting list that they almost have a life of their own, propelled by national subspecialty pressures in some cases and the discovery of neglected waiting lists in others.
The ambition this financial year is that their numbers should halve, so the line needs to turn decisively downwards in the next set of data if that ambition is going to be achieved.
At specialty level, General Medicine breached the 18 week mark at the end of June and waiting times there have continued to rise, reaching 18.4 weeks at the end of July. Only rheumatology and geriatric medicine are below 18 weeks at national level.
Local detail
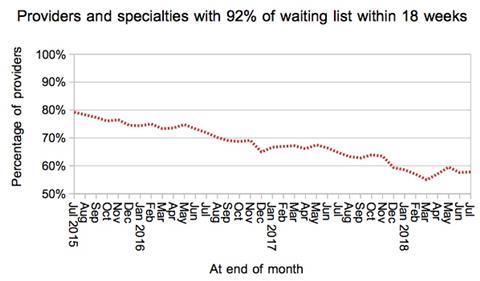
In line with waiting times overall, the proportion of local services achieving 18 weeks remained steady at 58 per cent.
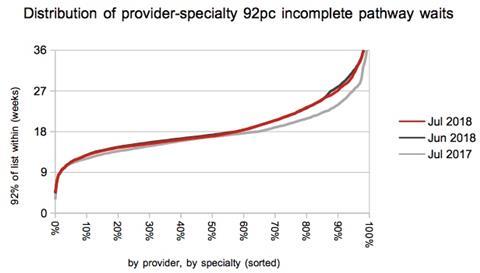
There was also little change in the distribution of local waiting times during July, although it is clear that waiting times have risen over the last year, particularly at the longer-waiting end of the distribution.
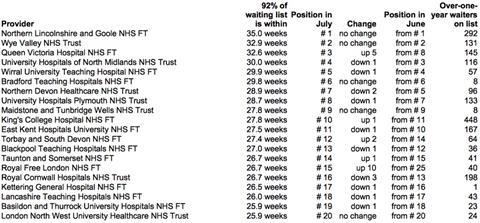
Even the table of top 20 longest-waiting providers was fairly static, although the Royal Free London Foundation Trust has reappeared on the table for the first time since April.
RTT data for August 2018 is due out at 9:30am on Thursday 11th October.
Dr Rob Findlay is director of the software company Gooroo Ltd,


No comments yet