


A larger waiting list, more patients over 18 weeks, and rising waiting times, all fuelled by a low elective admission rate. There is little to cheer about in August’s RTT statistics.
England’s waiting list grew again for the seventh consecutive month, casting doubt on the ambition to avoid any waiting list growth across 2018-19. The number of over 18 week waiters rose by more than 5 per cent in August to 530,000 patients.
Meanwhile, England’s waiting times went up by half a week during August to 22.1 weeks, which is the longest waiting time since March 2009 when the standard was in the process of being achieved for the first time. At local level, only 54.6 per cent of provider specialties are now achieving the 18 week standard, which is the worst position since early 2009 as well.
In the following discussion, all figures come from NHS England. If you have a national statistic that you’d like to check up on, you can download our RTT waiting times fact checker.
England wide picture
Waiting times ticked up again to 22.1 weeks, as the NHS struggled to admit long waiting patients amid continued pressure on capacity.
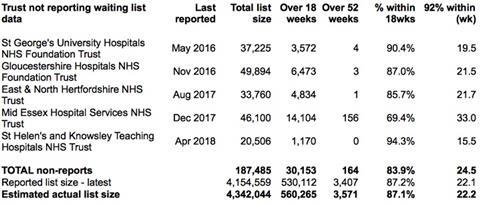
The list of non-reporting trusts was unchanged on the previous month.
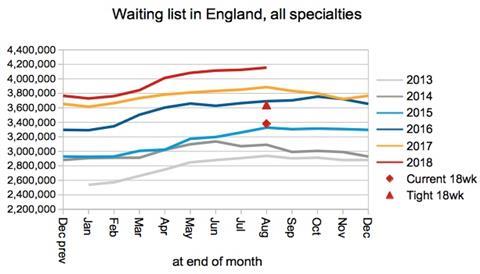
The waiting list is supposed to finish this financial year no bigger than it started, according to the planning guidance. So, how is that going? The usual pattern is for the waiting list to grow in the first half of the calendar year and then shrink in the second half, which makes it tempting to wave aside any recent growth as being merely seasonal.
But, looking at the chart below, it is rather ominous that the waiting list has continued to grow so strongly through August. The next set of data will be crucial, and if September doesn’t start to see some seasonal shrinkage in the waiting list then another full year of waiting list growth will be on the cards.
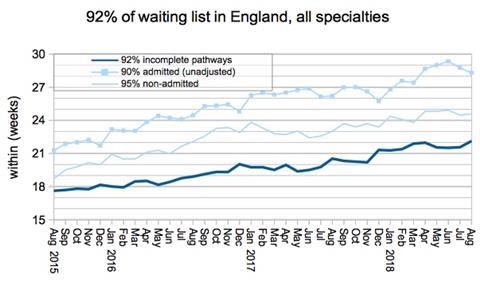
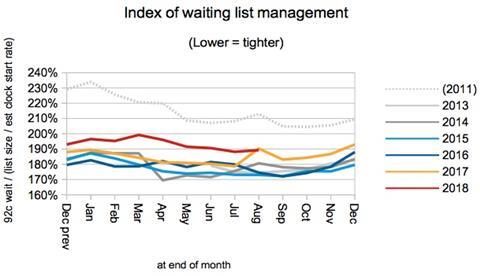
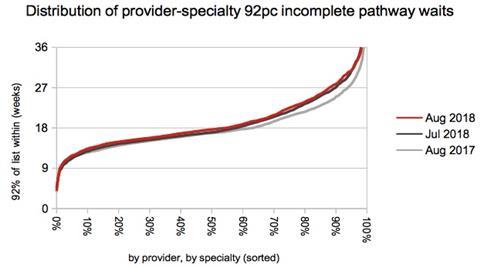
Waiting times are broadly driven by the size of the waiting list, and the order in which patients are treated (both within individual waiting lists, and because some lists are longer than others). The next chart bundles up all drivers other than list size, and it tells an interesting story.
Waiting list management improved sharply in 2012 when the incomplete pathways standard was introduced, ending the perverse incentives for trusts to avoid treating their longest waiting patients. For the next five years, the index of waiting list management remained consistently tight, with only seasonal variation.
However, in August 2017 the index suddenly lurched upwards. It is not clear why, but it may have indicated the beginning of year round capacity pressures which made it harder to admit the longest waiting patients, possibly with a delayed response to the removal of financial penalties around the referral to treatment waiting time standard.
In the latest figures, we can see that August 2018 has come in precisely where it left off the year before. Although a higher index represents greater inequality of waiting times, and longer waiting times overall, it is encouraging that it has not continued to climb – I had feared that it would, because of this year’s emphasis on the size of the waiting list.
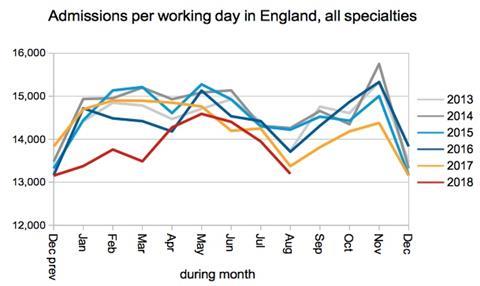
Admissions per working day continue to run low compared with recent years.
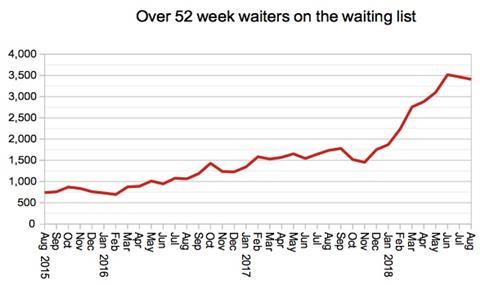
The number of one year waiters is taking a breather after rising steeply for several months. It is supposed to halve this financial year to 1,378, which is not looking terribly likely.
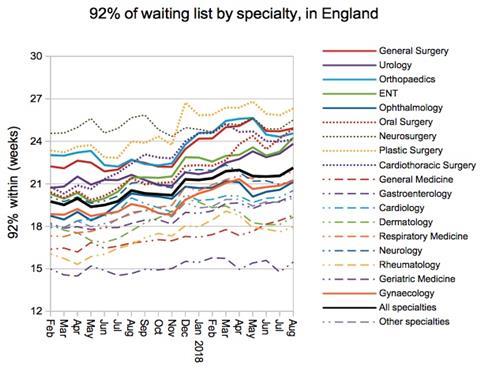
Rheumatology limboed under 18 weeks again at 17.95 weeks – achieving the standard by just 87 patients nationally. Together with geriatric medicine, they are the only specialties that remain within the standard.
Local detail
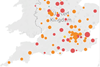
The proportion of local services achieving the 18 week standard fell again, below the recent dip in March to a new post-2009 low of 54.6 per cent.

The deterioration in August was very evenly spread, with waiting times rising throughout the distribution.
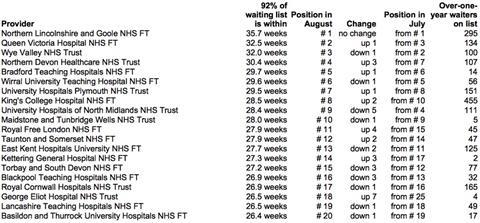
The top 20 longest waiting providers are shown in the table below. When looking at the number of one year waiters at each provider, it is worth remembering that within the last five years there have been as few as 214 in the whole of England.
Referral to treatment data for September 2018 is due out at 9:30am on Thursday 8th November.


3 Readers' comments