


One year waiters should be going down, instead they are soaring, warns Rob Findlay
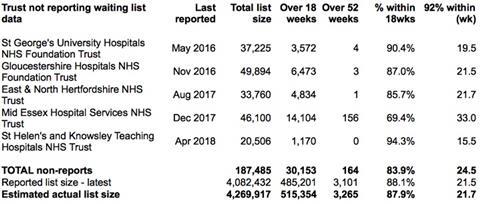
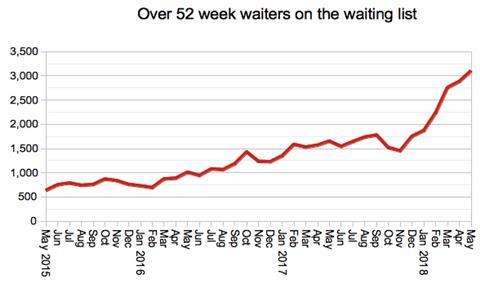
The number of one year waiters has more than doubled in just six months, from 1,452 in November 2017 to 3,101 in May 2018, according to the latest referral to treatment data.
One year waiters are specifically targeted in the planning guidance for 2018-19, which says “Numbers nationally of patients waiting more than 52 weeks for treatment should be halved by March 2019, and locally eliminated wherever possible”.
However, the numbers are going in the wrong direction and have already risen by 13 per cent this financial year.
In the following discussion, all figures come from NHS England. If you have a national statistic that you’d like to check up on, you can download our RTT waiting times fact checker.
England wide picture
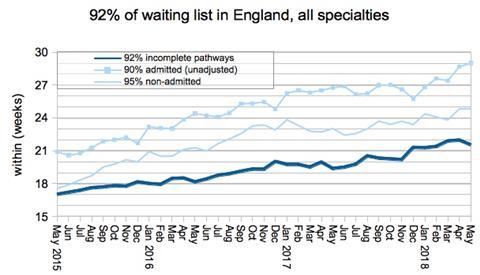
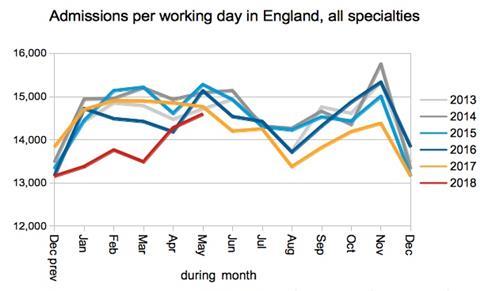
Waiting times fell slightly during May (as they have done every May since 2015), as spring finally arrived and elective admission rates recovered.
Turning briefly to the non-reporting trusts: Northern Devon Healthcare Trust started reporting again, and its waiting list grew from 8,028 to 13,823 in the year they were away.
St Helens and Knowsley Teaching Hospitals Trust has dropped out of the data as it replaces its hospital IT system, even though its (good) 18 weeks performance in May was reported as normal in its June trust board papers.
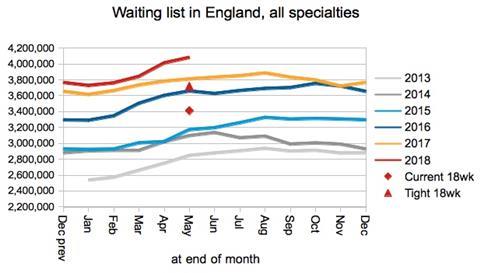
Returning to the figures as they were reported, the waiting list grew during May, which is normal for the time of year.
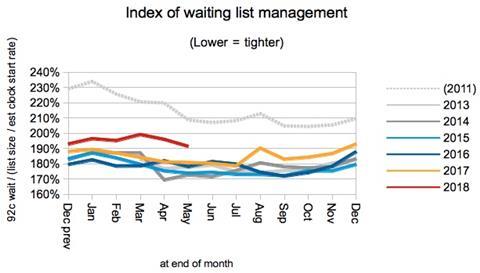
The index of waiting list management, which indicates how factors other than the size of the waiting list are contributing to long waiting times, has improved slightly during this financial year. This is good news, and suggests that efforts to control the size of the waiting list are not having unintended consequences.
Admission rates continued their recovery as winter gave way to spring, and pressures on emergency departments abated.
Looking now at the longest waits, I have changed the next chart to remove the data on over 18, 26 and 39 week waiters, and use a normal scale instead of a logarithmic one. Now, it can clearly show that one year waiters are going up like a rocket. I should probably have done this ages ago.
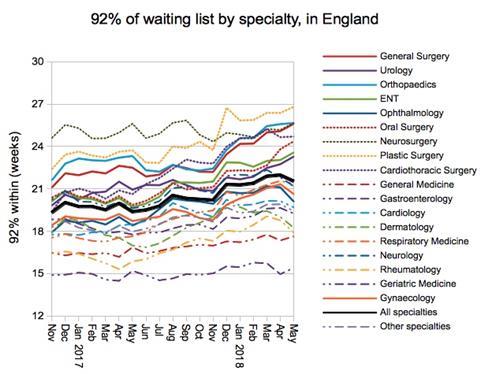
The specialty level picture was mixed in May, and it is good to see that orthopaedic waiting times have stabilised, albeit at a level that breaches by some margin the 18 week right in the NHS Constitution.
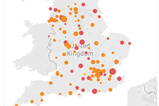
Local detail
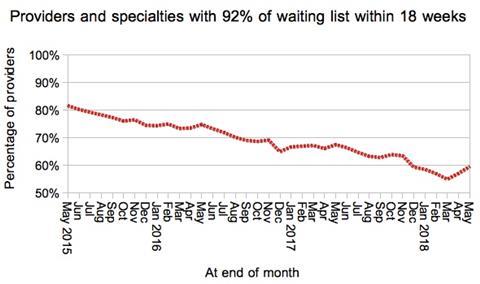
At local level, the proportion of services achieving 18 weeks continued to recover after the end of winter, rising to nearly 60 per cent at the end of May.
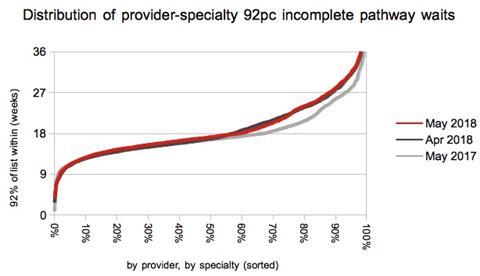
The chart above shows where the red line in the following chart crosses 18 weeks. It shows that waiting times improved in those services that were breaching only narrowly, but that waiting times deteriorated slightly at both the shorter waiting and longer waiting end of the spectrum.
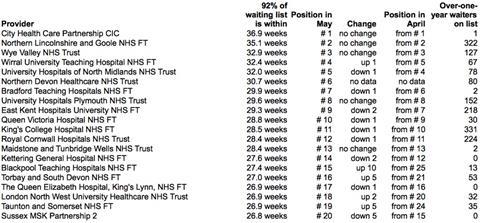
There was little movement in the top 20 longest waiting providers, although waiting times at the very top of the table came down from over 41 weeks to just 37 during May.
RTT data for June is due out at 9:30am on Thursday 9th August.
Downloads
RTT waiting times fact checker
Excel, Size 0.16 mb


No comments yet