


August saw a sudden increase in elective waiting times, putting at risk the NHS long-term plan’s promise of choice at six months.
English referral-to-treatment waiting times rose sharply in August to nearly 24 weeks. The drivers were partly a rapidly-growing waiting list, but mostly a change in the shape of the waiting list as the longest waiting times grew.
This has consequences for the NHS long-term plan, which promised that “anyone who has been waiting for six months will be reviewed and given the option of faster treatment at an alternative provider”. This will be a hollow choice in many parts of the country as waiting times increasingly exceed that threshold.
Why did longer waiting times slip so quickly in August (as they have done before in August 2017)? The short answer is that I don’t know, but the most likely explanation is pressures on hospital capacity.
In the following discussion, all figures come from NHS England and NHS Improvement. If you have a national statistic that you’d like to check up on, you can download our RTT waiting times fact checker.
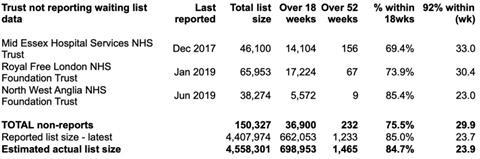
RTT waiting times shot up in August to 23.7 weeks (on the reported figures), which is the longest since January 2009.
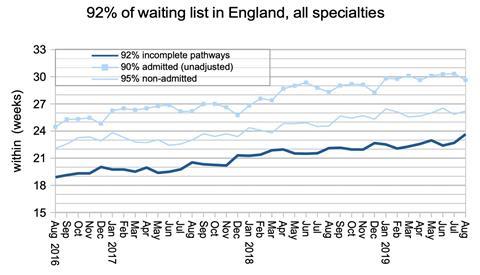
If you add back in the last known positions at non-reporting trusts, that figure becomes 23.9 weeks.
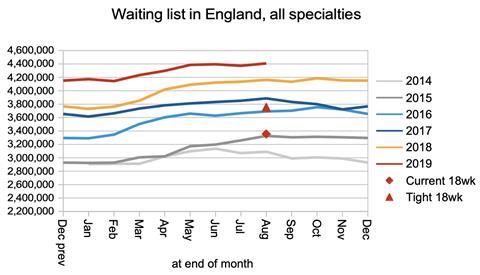
In the long term, rising waiting times are mostly driven by the rapidly growing waiting list.
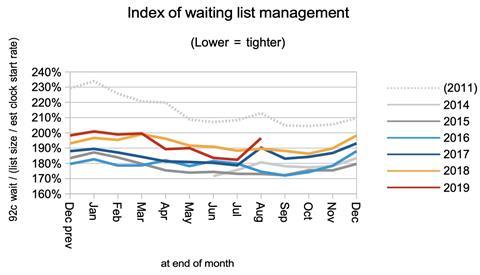
But in the short term, the management of the waiting list can cause waiting times to change much faster, and this is what happened in August (as it did in August 2017).
Why? The short answer is that I don’t know, but there is ample evidence of severe capacity pressures across the system (particularly in the ongoing run of exceptionally poor accident and emergency waiting times), so that is perhaps the most likely explanation.
But can anyone explain why August is particularly affected? Summer holidays are the obvious feature of August, but when the index of waiting list management spiked in August 2017, it didn’t fully recover when the holidays were over, and remained high for a year.
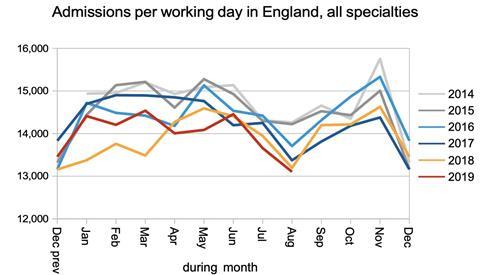
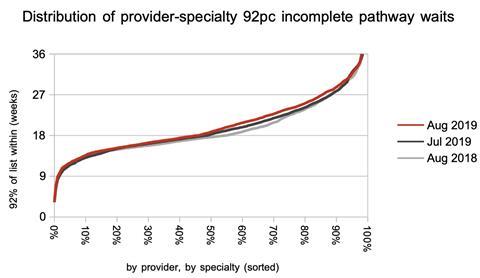
The rate of admissions (as inpatients or day cases) was low even for an August, and again capacity pressures are likely to be the main cause. Admitted patients dominate the longer-waiting end of the waiting time spectrum (as the first chart above shows) so lower admission rates could explain the deterioration we are seeing in the longer-waiting end of the spectrum.
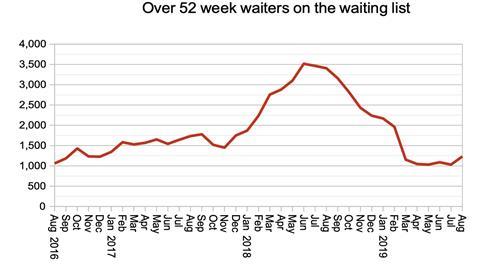
The number of one-year waiters is broadly steady following last year’s dramatic improvements. However, if the overall pressures on waiting times continue then we can expect these ultra-long waits to increase in future.
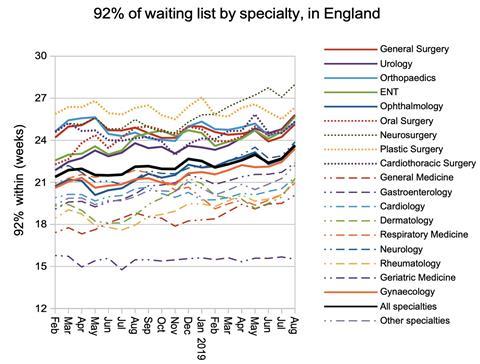
The increase in waiting times was seen in all specialties (apart from geriatric medicine), with no evidence on this measure of heavy-case mix specialties (such as orthopaedics) being more affected than lighter-case mix ones (such as ophthalmology).
Local detail
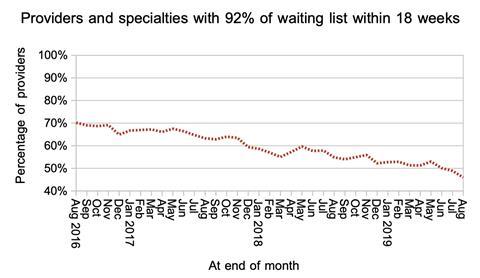
Only 46 per cent of local services (specialties within trusts) are now achieving the “92 per cent of incomplete pathways within 18 weeks” target.
The increase in waiting times was concentrated at the longer-waiting end of the spectrum.
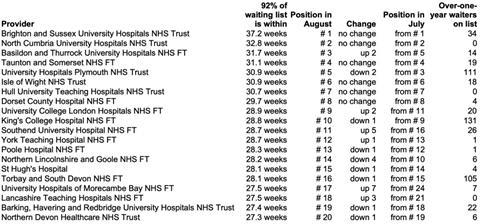
There was little change in the list of top 20 longest-waiting providers during August.
Last month somebody asked why I only list the longest-waiting providers, without also cheering the shortest-waiting ones. So in the interests of balance, let’s hear it for Inhealth Ltd, Wiltshire Health & Care, Somerset Partnership Foundation Trust, and North West CATS, all of whom have significant sizes of waiting list and achieved 92nd centile waiting times below 10 weeks at the end of August.
Referral-to-treatment data for September is due out at 9:30am on Thursday, 14th November.
Downloads
RTT waiting times fact checker
Excel, Size 0.17 mb


3 Readers' comments