


RTT waiting times shot up in December as winter started to bite. In better news, one year waits continued to fall. By Rob Findlay
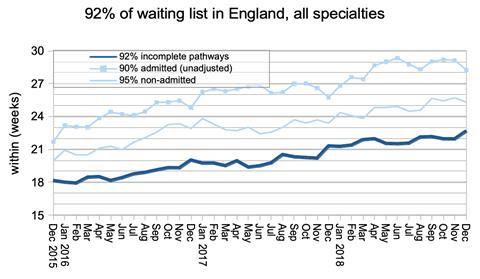
Referral-to-treatment waiting times shot up from 22.0 to 22.7 weeks in December, as winter started to bite. These are the longest waits since March 2009, when the original “18 weeks” targets were still settling in.
And accident and emergency waits (which are released a month earlier than RTT) sank to their worst ever performance in January which is an ominous omen for next month’s data.
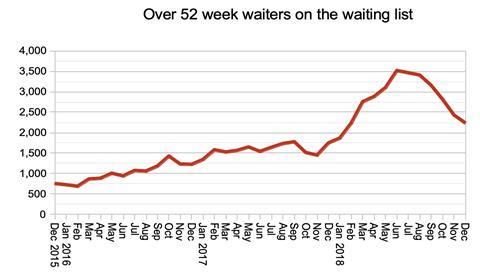
In better news, one year waits continued to fall. They are now 19 per cent lower than at the start of this financial year. The target was a 50 per cent fall across the whole financial year, which is looking unlikely, but at least this important metric is heading in the right direction.
In the following discussion, all figures come from NHS England. If you have a national statistic that you’d like to check up on, you can download our RTT waiting times fact checker.
England-wide picture
RTT waiting times rose sharply in December, as so often happens at the start of winter when A&E waiting times rise and beds are under pressure. Waiting times in Type 1 A&E departments did not deteriorate as fast this December as they did last year and the rise in RTT waits was more muted too.
A&E waiting times are released a month earlier than RTT, so they give us a sneak preview of the pressures to come. They deteriorated to their worst ever level in January, pointing to severe operational pressures which are likely to be reflected in the next set of RTT statistics.
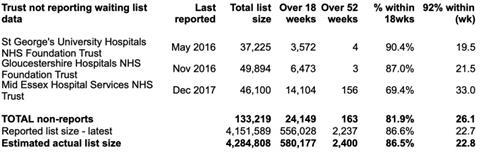
St Helens and Knowsley Teaching Hospitals Trust restarted RTT reporting in December, with a waiting list of 22,873, which is about 10 per cent larger than they dropped out with in April 2018. There are now only three non-reporting trusts on the official list.
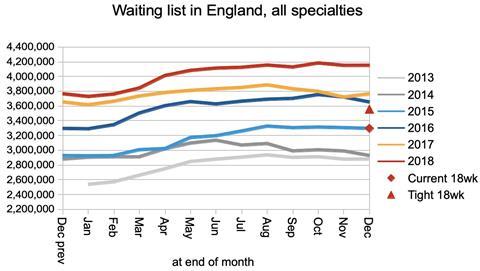
Returning to the reported data, the waiting list remained steady in December, which is a sign that this is a “bad year” for RTT waits – in a “good year” we would see a seasonal fall. With the current shape of waiting list, we are now three years of waiting list growth away from restoring 18 week waits.
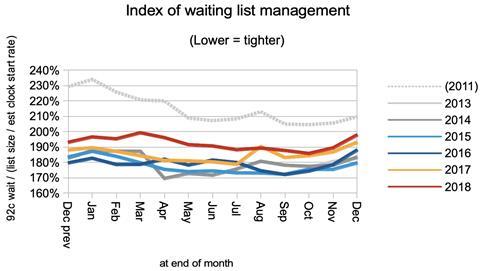
In a further sign of the pressures facing the NHS, the index of waiting list management rose again and is now markedly higher than it was this time last year.
This index sweeps up everything that influences waiting times other than the number of patients waiting. It improved dramatically when the incomplete pathways target was introduced in 2012, bringing with it incentives to treat routine patients in date order and smooth out the variations in waiting time pressures.
However, national waiting times policy has now reached the point where the NHS Constitution right to treatment within 18 week waits is simply unachievable, and attention has turned to stopping things from getting worse by keeping the list size down. So it is perhaps not surprising that the benefits of the incomplete pathways target have become blunted, and the index of waiting list management is rising towards pre-2012 levels.
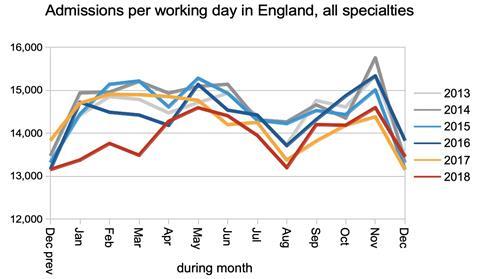
Admissions per working day were subdued in December, which is common as winter bites.
There was one bit of good news in the data. The number of one year waiters continues to fall and is now well below the number at the start of this financial year. It hasn’t halved, which was the target, but it’s heading in the right direction and that is important.
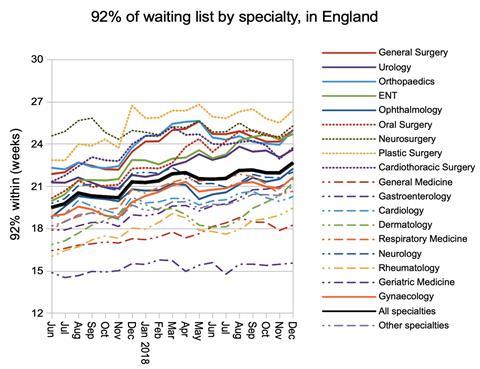
At specialty level, General Medicine ended its brief flirtation with “18 weeks” compliance, leaving only Geriatric Medicine within the target at month end. Surgical specialty waiting times rose sharply in line with overall performance.
Local detail
The proportion of local services (specialties within providers) achieving the 18 week standard fell sharply to just 52.3 per cent – agonisingly close to “18 weeks” compliance becoming the minority. Perhaps it tipped over in January – we’ll find out next month.
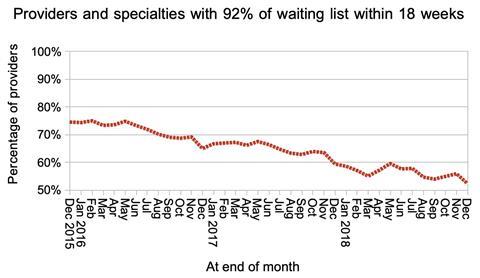
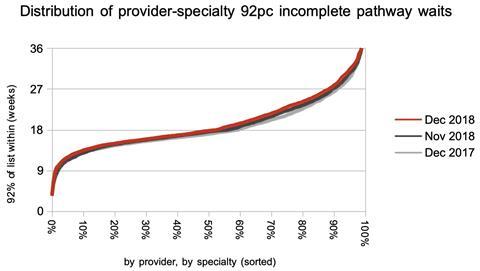
The deterioration was mostly at the longer-waiting end of the spectrum, where waiting times grew nearly as fast in December as they had over the previous 11 months.
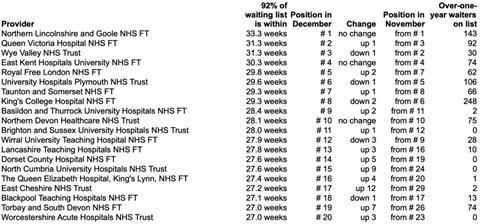
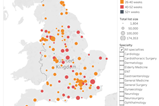
North Cumbria University Hospitals Trust and East Cheshire Trust both rose into the top 20 longest-waiting providers in December as their waiting times continued to lengthen. Torbay and South Devon Foundation Trust popped onto the table too, although their waits have generally been coming down since the summer.
Referral-to-treatment data for January 2019 is due out at 9:30am on Thursday 14th March.
Dr Rob Findlay is director of software company Gooroo Ltd,


1 Readers' comment