














“We are data-rich, but I think it’s fair to say we’re intelligence-poor.”
Sponsored and written by
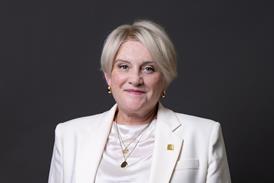
Steve Hams, chief nursing officer at North Bristol Trust, has described how a connected system can help leaders answer a fundamental question: are we providing good care?
The issue is not a lack of information.
Most organisations already capture large volumes of quality, safety, and governance data. The question is whether that information is helping leaders make better decisions when operational pressure peaks.
As winter demand intensifies, the gap between being data-rich and turning that data into actionable intelligence becomes increasingly important.
What your dashboard shows versus what it tells you
Most dashboards are good at answering questions you already knew to ask: incident volumes, overdue actions, or reporting rates.
That’s reporting.
Analytics becomes valuable when it identifies something leaders were not already looking for, reveals hidden patterns, and connects those insights to clear actions and accountable owners.
During winter, capacity pressures and staffing shortages make emerging risks harder to spot.
If a dashboard simply confirms what a team already knows, it may be useful for assurance. But it is unlikely to influence operational response.
The analytics that make a difference in a January escalation meeting are those that identify emerging risks early enough for teams to intervene, assign ownership, and implement preventative measures.
At Mid Yorkshire Teaching Trust, a pressure ulcer dashboard enables the tissue viability team to filter data by ward and use body-map analytics to identify pressure-ulcer hotspots. The insight is being used to support targeted prevention and education initiatives, including focused training around device positioning, skin assessment, and pressure relief.
This is the difference between analytics that describes what has happened and analytics that helps teams decide what to do next.
Designing analytics around decisions, not data
Somerset Foundation Trust provides a practical example of this shift in thinking.
The trust explains that Radar Healthcare analytics helps it spot positive and negative trends quickly, take action, and share learning across the organisation.
The value comes from connecting an insight to a response: identifying where a pattern is emerging, deciding who needs to act, and sharing the learning with the teams that can make a difference.
In practice, this means deciding in advance which decision the analysis should support. Too often, organisations begin with available data and only later consider what action the insights should drive.
The strongest use cases begin with questions such as: which patients, wards, services, or processes may be at increased risk, and what preventive action could reduce that risk?
At NBT, Radar Healthcare is being used to consolidate governance data and processes, helping teams build a more complete view of risk, quality, and improvement. The trust reports that this supports real-time learning, quick improvement cycles, and a clearer story of how actions are contributing to better care.
The shorter the gap between identifying a pattern and acting on it, the more likely organisations are to maintain quality and safety during periods of sustained pressure.
Analytics without workflow is only half the solution
Even the most sophisticated analytics become ineffective if the actions that follow sit in spreadsheets, inboxes, or disconnected processes.
This is where digital workflow becomes the other half of operational resilience.
The goal should be a closed loop: identify the signal, assign the action, track progress, and measure the outcome within the same workflow.
NBT highlights the value of a single action list linking actions to relevant events, displaying progress through dashboards, and supporting effective reporting. At University Hospitals Birmingham FT, incident workflows include automated allocation to the appropriate teams, shared access for collaboration, and structured reviews within 24-48 hours for significant events.
The lesson is that analytics should not simply generate more alerts. It should connect insight with accountable action so emerging risks can be investigated, preventative steps can be put in place, and progress can be measured.
Questions to ask
- What decision is this dashboard designed to change?
- What risks or trends can it identify that we are not already looking for?
- When a signal is detected, who owns the response and how will we know whether the action has reduced the risk?
Next step
As organisations prepare for winter pressures, analytics-led governance can help turn safety data into actionable intelligence, supporting faster decisions, clearer accountability, and more effective operational resilience.
The organisations best placed to manage pressure will be those that can connect information across systems, identify emerging risks early, and turn insight into owned, measurable action.