


Long waits deteriorated across the board in December, especially in the longer waiting services. Even so, there is a decent chance of the English NHS delivering its 18 week targets right up to the general election, says Rob Findlay
Three months of flawless waiting times statistics: that’s what the government wants in the run-up to May’s general election.
‘The waiting list is now so large that not all of the 18 week targets are sustainable’
The latest data covers the first of those months: December 2014. Meanwhile, in the real world, the NHS is scrambling to hit all its targets for February, which will be the last month’s data published before the election.
- The remedies for perverse targets in NHS guidance
- England’s £250m waiting list initiative slips again
- England’s waits creep up again as election looms
Not to plan
Things have not been going to plan.
The hope was that the NHS would clear its backlogs last summer, so that everything would be in good shape to sustain short waits thereafter. But that didn’t happen. Waiting lists and waiting times are up year on year, and the waiting list is now so large that not all of the 18 week targets are sustainable. So the NHS is making an increasingly desperate dash for the deadline, as the waiting times position crumbles around it.

The two perverse 18 week targets, which restrict hospitals from treating their longest waiting patients, were reimposed in December after a much extended amnesty.
Those targets were met again in December, as the government intended.
But there is a price to pay.
If hospitals cannot treat all their longest waiting patients, then they are forced to keep them waiting. That pushes up the number of long-waiters remaining on the waiting list. And that puts the most important waiting times target – that 92 per cent of the waiting list must be within 18 weeks – at risk.
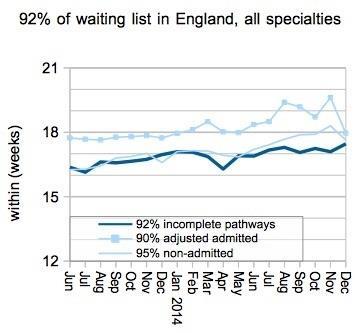
For the past couple of years, this crucial indicator has been creeping ever closer to breaching the 18 week target, reaching 17.5 weeks in the latest figures.
It hasn’t been this high since the start of 2012, when this new-ish target was first achieved.
Can it be kept below 18 weeks until the end of February? There’s a good chance it can, although the absurd restrictions on treating long waiting patients are not helping.
In the following analysis, all figures come from NHS England. If you have a national statistic that you’d like to check up on, you can download our NHS waiting times fact checker.
England-wide picture
A lot of trusts are not reporting their waiting list data.
Tameside started reporting again in December after a nine month absence, but Colchester and Medway have now dropped out (both have new PAS systems, apparently) bringing the level of non-reported waiting list patients to a record high. Here are the last known positions at each non-reporting Trust:
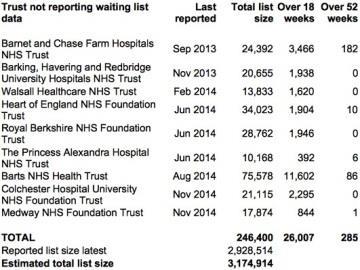
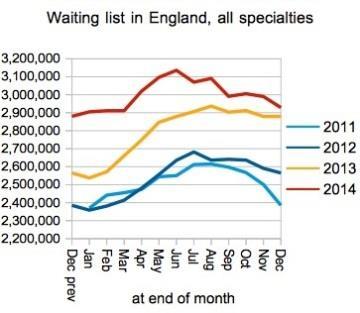
The charts below all omit these non-reporters, so don’t be fooled by the apparent improvements in the numbers waiting. Here is the total reported size of the English waiting list:
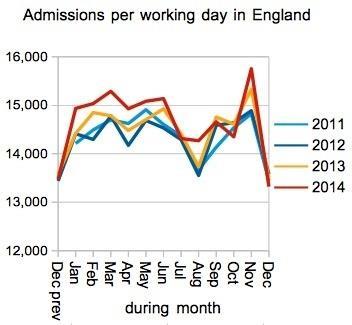
The number of patients admitted per working day was pretty much the same as in previous years, after a good surge in November.
Actually it was very slightly lower, which is disappointing at a time when the NHS was hoping to be going hell for leather to keep waiting times down.
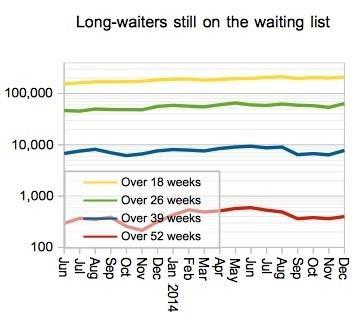
Long waiters edged up, despite the increase in non-reporting trusts. The persistence of one year waits on the English waiting list is a great pity, because the numbers are small and something wonderful could have been achieved if a concentrated effort had begun earlier.
Of the 399 reported one year waiters, some 201 are in a single service: Orthopaedics at North Bristol. I am guessing these are spinal surgery patients, a subspecialty where there is a national shortage of capacity.
The perverse “adjusted admitted” and “non-admitted” targets were reimposed in December, and both targets were duly met. But those figures only show how the NHS is responding to its targets and waiting times.
The “incomplete pathways” measure, which better indicates the scale of the problem, rose to its worst position since that target was originally achieved in early 2012.
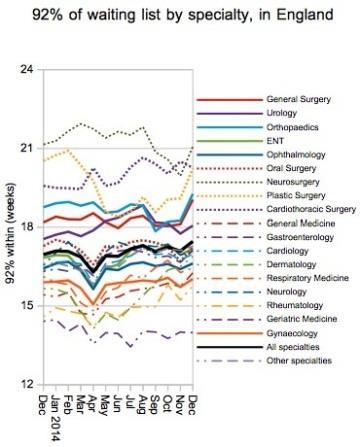
Waiting times went up fastest in those specialties which already had the longest waits – except for cardiothoracic surgery which improved slightly. Orthopaedics and general surgery deteriorated most among the big surgical specialties.
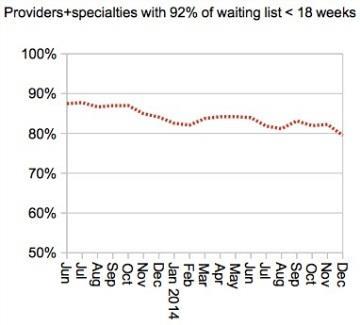
The number of services (at provider specialty level) that achieved the incomplete pathways target also fell to its worst level since early 2012, dropping below 80 per cent for the first time since March 2012.
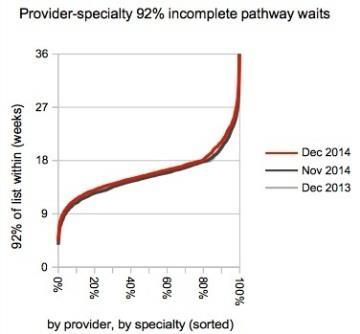
Waiting times deteriorated across the board, with the worst declines seen in those provider specialties that already had the longest waits.
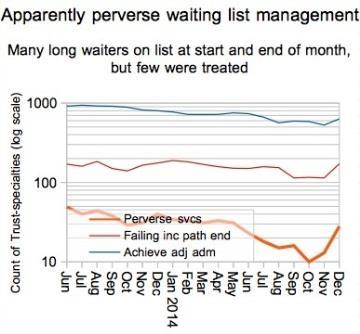
Now that the two perverse 18 weeks targets have been reimposed, we might expect to see an increase in the number of provider specialties that are managing their waiting lists perversely. Indeed we do.
The number of services with apparently perverse waiting list management rose sharply from 13 in November to 28 in December.
I am using quite a strict test for detecting perverse management: the incomplete pathways target must be failed at both the start and end of the month, and both the adjusted admitted and non-admitted targets must be achieved during the month.
In other words, the service must have started and ended the month with lots of long waiting patients on the list, but selected mostly short waiting patients for treatment instead. So those 28 services are likely to be the tip of the iceberg.
Local detail
North Bristol stayed at the top of December’s top 20, and Tameside ended its “reporting break” by jumping straight in at number two. There wasn’t much change in the rest of the table.
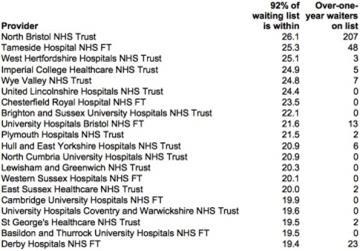
Congratulations to Sheffield Children’s Foundation Trust for dropping out of the table from 12th place to 35th, cutting 92nd centile incomplete pathway waits from 20 weeks to 17.9 weeks.
Three other trusts dropped out of the table even though their waiting times got worse, as they were overtaken by other trusts who deteriorated even faster.
Data for January 2015, the penultimate month to be published before the general election, is due out at 9:30am on 12 March.
The latest official statistics calendar also confirms publication dates for the next two months: the February figures will be out on 9 April, and the March figures will be out a week after the election on 14 May.
Rob Findlay is founder of Gooroo Ltd and a specialist in waiting time dynamics
Topics
- East of England
- East Suffolk and North Essex NHS Foundation Trust
- General election 2015
- MEDWAY NHS FOUNDATION TRUST
- NHS England (Commissioning Board)
- NORTH BRISTOL NHS TRUST
- Performance
- SHEFFIELD CHILDRENS NHS FOUNDATION TRUST
- South
- South West
- TAMESIDE HOSPITAL NHS FOUNDATION TRUST
- Targets
- West Midlands
- Yorkshire and the Humber


No comments yet