


Rob Findlay’s insight on the last RTT data before the covid-19 elective shutdown leads to the conclusion that now is a good time to take stock
February’s data on referral-to-treatment waiting times is the last before elective activity was largely shut down, as part of the colossal effort to free beds for covid-19 patients.
We are going to hear a lot in the coming months about the impacts of covid-19 on the NHS, and a bigger elective waiting list will be one of them. So this is a good time to take stock of how things stood beforehand.
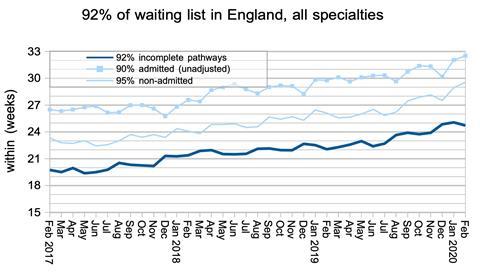
The official standard, still enshrined in regulations, is that 92 per cent of the RTT waiting list should extend no further than 18 weeks. The best performance ever recorded was 15.8 weeks back in April 2013. The current waiting list extends nearly to 25 weeks, and waits are rising by about 1.5 weeks per year.
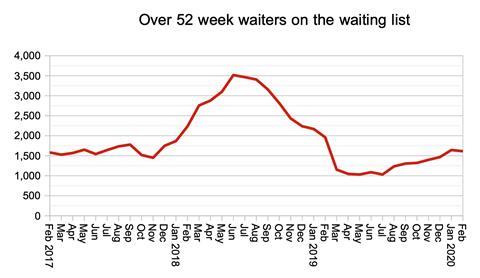
The official standard is that no patient should have waited longer than 52 weeks. The best performance ever recorded was in November 2013, when just 214 patients were waiting longer. By June 2018 that number had risen to 3,516, and although it then fell sharply in a determined effort, it has been creeping up again and now stands at 1,613.
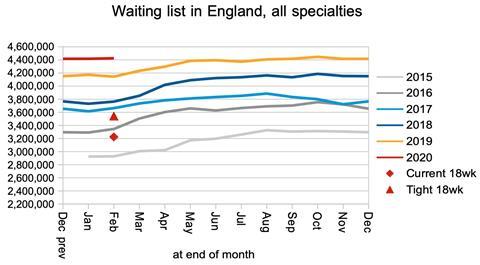
A waiting list grows when activity is not keeping up with demand, and today’s waiting list is the accumulated shortfall since the dawn of time. When RTT records began in August 2007, there were 4.2 million patients on the RTT waiting list. As early as January 2009 it had shrunk to 2.3 million, the smallest RTT waiting list ever recorded. But in recent years it has been growing by more than 7 per cent year-on-year, and by the end of February 2020 it had reached 4.4 million patients.
All this has happened without covid-19. The current elective shutdown will of course accelerate the decline. But when the crisis is over, and we look back at the impact that covid-19 has had on the NHS, it will be worth remembering how bad things already were before the storm.
In the following discussion, all figures come from NHS England and NHS Improvement. If you have a national statistic that you’d like to check up on, you can download our RTT waiting times fact checker.
England-wide picture
Waiting times reduced slightly in February as the NHS managed to admit more long-waiting patients, although this did not result in a reduction in the overall numbers waiting.
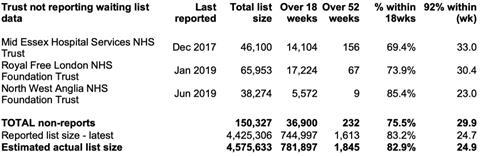
The list of non-reporting acute trusts was unchanged on the previous month. If the last known positions at non-reporting trusts are added back in, the waiting list stands at over 4.5 million patients.
The English waiting list has remained steady (to within 2 per cent) since June 2019, but this is not going to last. The waiting list usually grows strongly in the spring, and this year the covid-19 elective shutdown will make that growth a lot stronger.
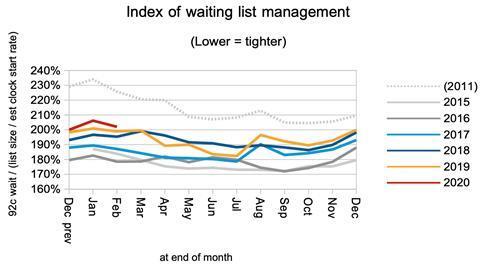
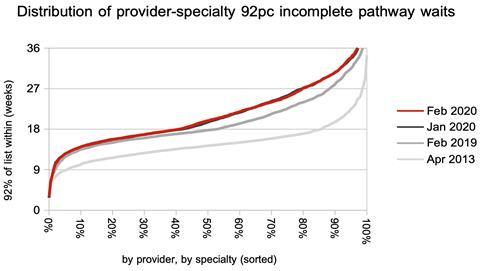
The deterioration in RTT waiting times has not only been driven by the growing waiting list. The shape of the waiting list has worsened too, and grown a longer tail.
This is captured by the index of waiting list management below. It improved dramatically when the incomplete pathways target was introduced in 2012, and remained good until 2017, but since then it has been deteriorating and now stands at the worst level in recent years.
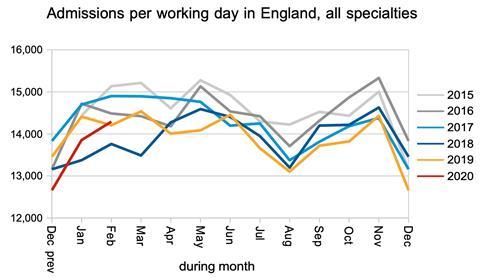
The rate that patients are admitted from the RTT waiting list (as inpatients and day cases) has declined in recent years, as capacity pressures made it difficult for the NHS to keep these activity levels up. Although this January and February were not as awful as last year, the admission rate was still low in comparison with recent years.
I am expecting one year waiters to be particularly affected by the covid-19 shutdown, because the NHS has long found it difficult to admit those patients who will spend the longest in theatre and on the wards, and those are exactly the patients who are most likely to be delayed to free up beds during the current crisis.
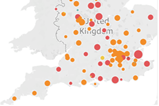
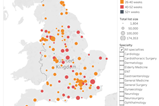
Most of the NHS has actually been very successful at keeping a lid on these extremely long waiting times. One-year-waiters are highly concentrated, with half of them waiting at just nine trusts. In fact, if you break the data down by trust and by specialty, half of them are waiting at only 23 out of over 2,000 local services across England.
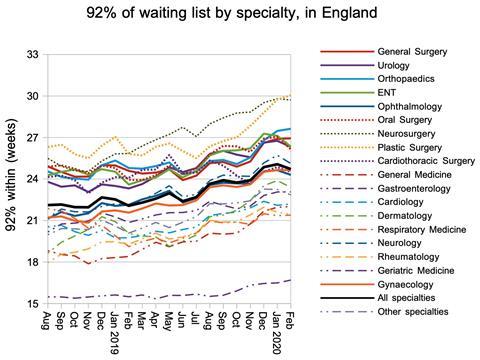
At specialty level, the longest waiting times are in plastic surgery and neurosurgery, and of the largest specialties orthopaedics has the longest waits. Only geriatric medicine remains below 18 weeks, but even there waiting times are now rising.
Local picture
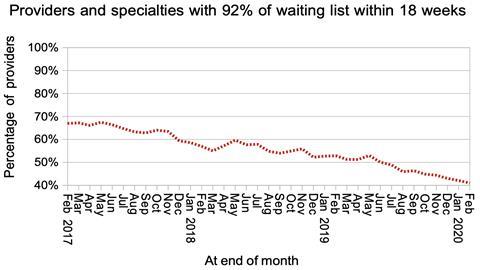
Just 41 per cent of over 2,000 local services (by trust, by specialty) are now achieving the 18 week standard.
Waiting times have mainly been rising at the longer-waiting end of the distribution.
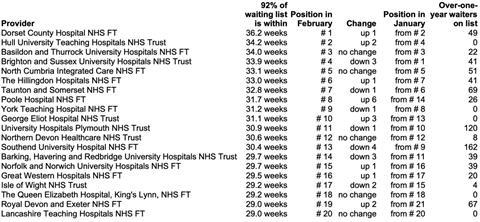
Brighton and Sussex University Hospitals Trust was top of the table of longest-waiting providers for nine months on the trot. But no longer. Their waiting times fell by over a week and a half in February, bringing them down to fourth place on the list. Well done to them.
Their place is now taken by Dorset County Hospital NHS Foundation Trust, who have been edging closer to the top of the table for some time.
Downloads
RTT-waiting-times-fact-checker
Excel, Size 0.17 mb


1 Readers' comment