


The request to postpone elective care was enacted quickly and comprehensively, the latest RTT data suggests. By Rob Findlay
The covid-19 elective shutdown began in mid March. We now have referral-to-treatment waiting time data up to the end of March. And the impact of the shutdown is already very clear.
Long-waiting patients everywhere simply remained on their waiting lists, their waiting times rising by one day, every day. Admissions virtually ceased. And referrals ran at a fraction of their usual rate.
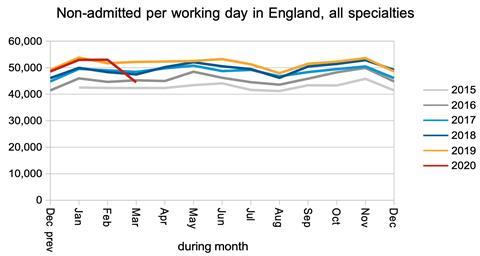
More hopefully, non-admitted clock stops largely held up, although the data does not reveal how much of this was outpatient activity and how much was removals from the waiting list.
Keeping on top of outpatients will be key to a safe and successful post-covid recovery. Safe, because many patients with cancer are referred as “routine”, and those cancers will not be detected quickly enough while routine waits remain long. Successful, because huge outpatient waiting lists are difficult to administer without losing patients in the system and creating inefficiencies.
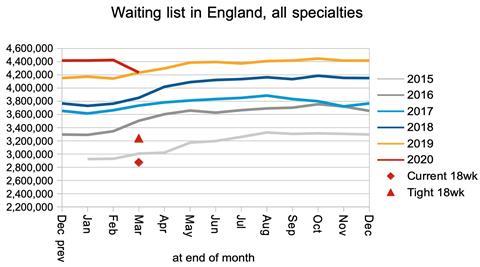
The waiting list is the net result of this enormous tug of war between plummeting clock starts and plummeting clock stops. The list shrank slightly. But that is no consolation, because many of the referrals which didn’t happen in March will return, as they should, as the NHS gets back to its feet.
In the following discussion, all figures come from NHS England and NHS Improvement. If you have a national statistic that you’d like to check up on, you can download our RTT waiting times fact checker.
England-wide picture
On 17th March, NHS England and NHS Improvement asked the NHS to “Assume that you will need to postpone all non-urgent elective operations from 15th April at the latest, for a period of at least three months.” The RTT data suggests this was enacted quickly and comprehensively.
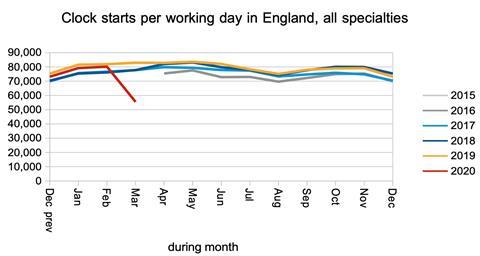
Let’s start with the numbers of patients being added to and removed from the waiting list – the enormous tug of war mentioned earlier.
Bearing in mind that the NHS England and NHS Improvement letter was sent just over halfway through the month, this is what happened to “clock starts” (broadly, elective referrals). This dramatic reduction would tend to reduce the size of the waiting list. However, many of these referrals have been delayed rather than permanently avoided, so we can expect a surge in referrals as the NHS catches up.
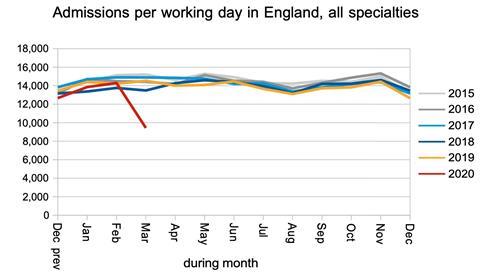
Now let’s look at the rate of “clock stops” as patients are admitted from the waiting list, or are “non-admitted” because they are seen in clinic or removed for other reasons. These reductions would tend to increase the size of the waiting list. The fall in admissions is very large indeed.
The fall in non-admitted clock stops is much less dramatic, and if this means that the NHS has been able to keep on top of most outpatient demand, then that would be good news.
The change in the size of the waiting list during the month is, broadly speaking, the difference between the number of clock starts and clock stops. (I say broadly, because if you actually cross check the data it doesn’t balance at all well.)
The net result is that the waiting list shrank. However, as noted above, this can be expected to reverse when the NHS catches up with the delayed referrals.
Waiting times rose by 1.8 weeks during March, which is consistent with very few long-waiting (and presumably routine) patients being treated since the NHS England and NHS Improvement letter.
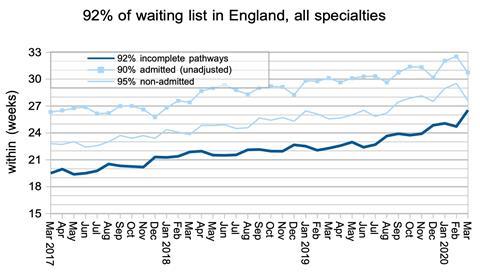
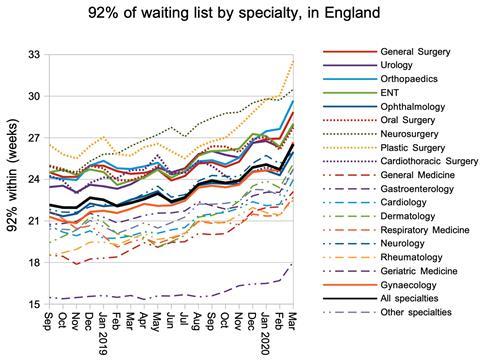
The same was true at specialty level.
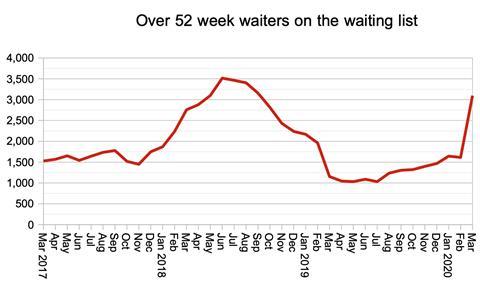
The number of one year waiters increased sharply, as long-waiting patients remained on the waiting list with their waiting times increasing by one day, every day.
Although this metric is eye-catching, I do not think it is particularly helpful at the moment. Any measure that relates to a particular waiting time, whether that is 18 weeks or 52 weeks, is most meaningful when performance is close to that measure.
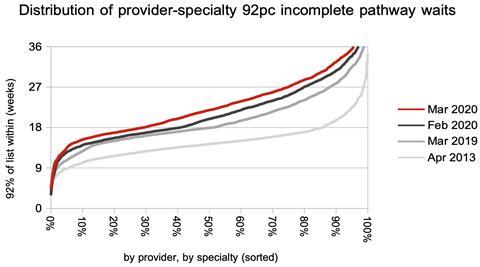
It would be more helpful to know how long (say) 99 per cent of the waiting list is waiting, just as it is more helpful to know how long 92 per cent of the list is waiting than the percentage within 18 weeks.
Local picture
The proportion of local services (by provider, by specialty) achieving 18 weeks fell sharply.
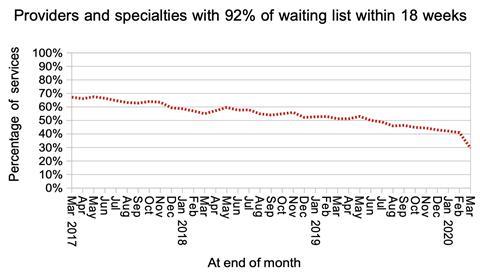
What is more interesting is the change in the distribution of waiting times. Waiting times increased by almost the same amount for short waiting services as for long waiting ones. This again is consistent with a comprehensive cessation of treatment for long waiting patients everywhere.
Referral-to-treatment data for April 2020, the first complete month of the covid-19 elective shutdown, is due out at 9:30am on Thursday 11th June.
Dr Rob Findlay is director of demand and capacity planning company Gooroo Ltd.


2 Readers' comments