


The best way for the next government to reduce waiting times will be steadily and patiently, by keeping up with demand. Not with a blitz of waiting list initiatives.
England’s referral-to-treatment waiting list grew to a new record size, in the last statistics to be released before the general election. (The next set of figures, for October, has been postponed until the day after the vote.)
Politicians from all sides will doubtless claim that only they can solve this problem. So here is a quick guide to reducing RTT waiting times, to help you tell which (if any) of those politicians is talking sense.
RTT waiting times are different from other waiting times that you hear about in, say, accident and emergency.
If the NHS could suddenly magic up enough capacity (like staffed beds and clinicians) then A&E waiting times would improve overnight. That is because A&E waits are transient, and the queue fluctuates between crowded and nothing as the hours and days go by. So any increase in the NHS’s capacity to absorb demand in A&E would have an immediate effect.
But RTT waiting times, which are for elective care, don’t work like that. Long RTT waits are mainly caused by large elective waiting lists – ie queues – which have accumulated over many years. In those years when the NHS is able to keep up with demand, waiting lists and waiting times get smaller. In years when it cannot keep up with demand, waiting lists and waiting times grow.
For most of this decade, the NHS has not kept up with the demand for elective care. So waiting lists and waiting times have grown. There are, broadly speaking, two ways of restoring short waiting times.
The usual approach is the one favoured by impatient politicians: hose the NHS with cash and pressurise it to achieve a fast result. Within the hospital, that means lots of extra sessions in clinic and theatre, paid at expensive extra-contractual rates. This is currently especially difficult because of the ongoing problems with the NHS pension.
It is also unsustainable, as suggested by that word “extra”. As soon as the extra sessions stop happening, the waiting list starts to grow again. Eventually we end up back where we started.
And yet we keep trying this doomed approach. It would be much better, cheaper, and less disruptive to recognise that elective waiting times are all about the direction of travel – they are either growing or shrinking. We should resolve to keep them steadily shrinking, by making sure that every clinical service has enough capacity to keep ahead of demand.
So elective waiting times will eventually be won, not in a big bang, but by a patient accumulation of successes. If George W Bush can appreciate the importance of this approach, then surely our own politicians can learn it too.
In the following discussion, all figures come from NHS England and NHS Improvement. If you have a national statistic that you’d like to check up on, you can download our RTT waiting times fact checker.
England-wide picture
Waiting times grew to 23.9 weeks at the end of September, based on the reported figures.
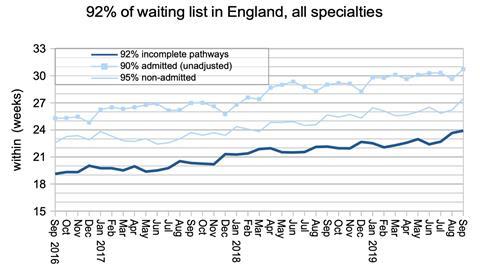
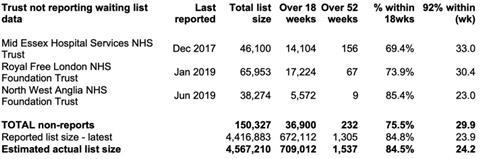
If you add in the last known positions at non-reporting trusts, that becomes 24.2 weeks. Either way, it is the longest reported RTT waiting time since January 2009 when the target was being achieved for the first time.
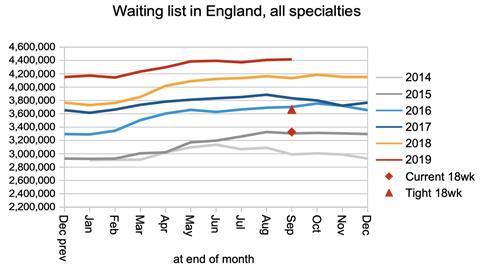
The main driver of waiting times is the size of the waiting list. This accords with our daily experience of queueing, which is that a longer queue means longer waits. The English waiting list has been growing for many years, and this is the main reason why waiting times have been growing too.
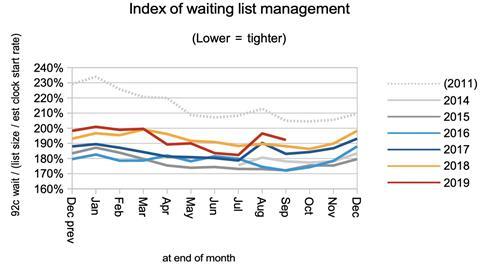
However the waiting list is not the only cause of long waiting times. The order in which patients are treated is also important, and that is summarised in the index of waiting list management below. This also accords with our daily experience of queueing, because queue-jumping, and having different queues of different lengths, both cause the longest waiting times to rise. (And the national waiting list comprises thousands of separate queues.)
The index of waiting time management suffered an unexplained deterioration in August and did not recover in September.
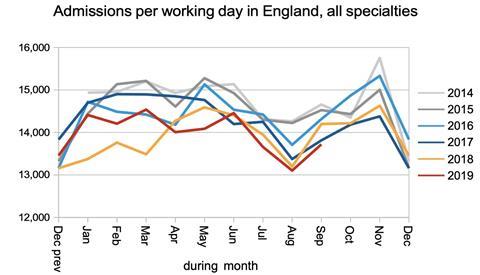
If the English NHS is going to keep up with demand and reduce waiting times, then it needs to do so for every service it provides: both specialist and general services, in every department of every hospital. This is hardest in those services that make the heaviest use of beds and theatre time.
Unfortunately, as the next chart shows, inpatient and daycase admissions from the waiting list have been running at historically low levels. This is likely to be caused by the same overall capacity pressures that are causing long waits in A&E – capacity that will need to be addressed if the NHS is to keep up with demand.
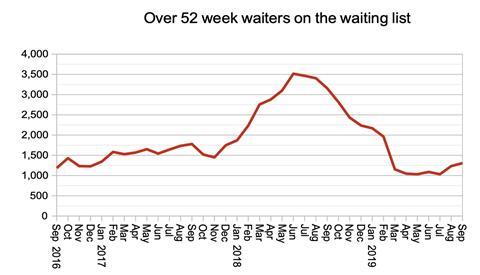
One year waits continue to creep up again, after the welcome recovery in the last financial year.
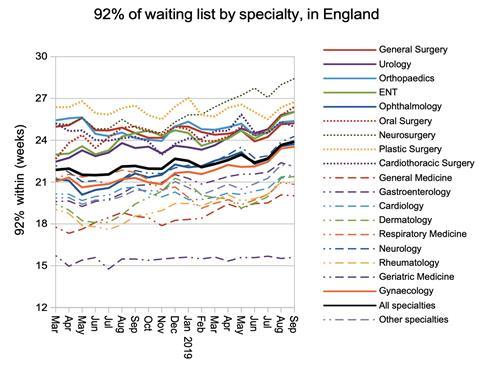
The increase in waiting times is seen fairly generally across all specialties, with the exception of Geriatric Medicine which remains within 18 weeks at national level.
Local detail
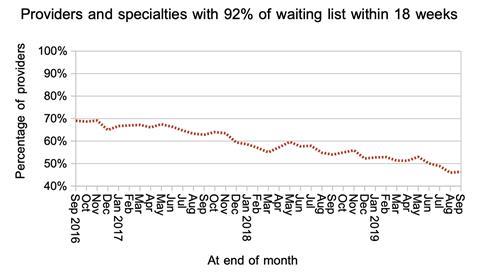
Only a minority of local services (specialties within providers) are achieving the 18-week standard.
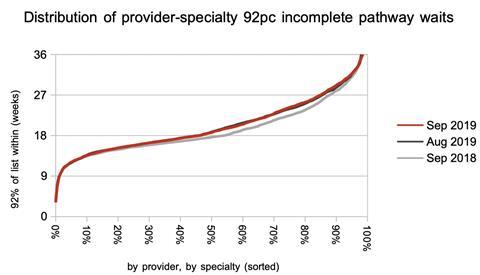
The distribution of waiting times did not change significantly in September, although long waits have risen markedly over the last year.
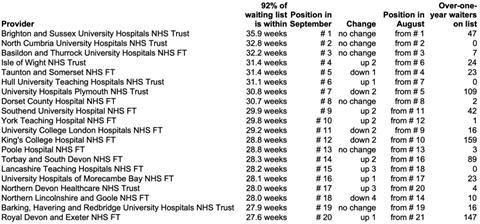
Although there was little change in the table of long-waiting providers in September, it is good to see Brighton and Sussex University Hospitals Trust reducing its waiting times from 37.2 to 35.9 weeks.
Referral-to-treatment data for October has been postponed until after the general election, and is due out at 9:30am on 13 December, Friday.
Dr Rob Findlay is director of software company Gooroo Ltd,


2 Readers' comments