


When the NHS keeps up with demand, the waiting list shrinks in the autumn. It isn’t shrinking, notes Rob Findlay
In a good year, when the NHS is keeping up with demand, the elective waiting list shrinks in the autumn before rising again in the spring.
In a bad year, when the NHS is not keeping up with demand, it flatlines in the autumn.
This is a bad year.
The effects have not yet fed through to waiting times, but they will in next month’s figures when the seasonal deterioration in the waiting list shape kicks in.
On past form, we could then see English waiting times rising quite rapidly from the current 24 weeks, to 25 weeks or longer, which would render the promise of choice at 26 weeks irrelevant in much of the country.
In the following discussion, all figures come from NHS England and NHS Improvement. If you have a national statistic that you’d like to check up on, you can download our RTT waiting times fact checker.
England-wide picture
Waiting times were steady in October, as a slightly larger waiting list was balanced by a slightly tighter waiting list shape. However, this is not good news because the waiting list should be shrinking seasonally at this time of year.
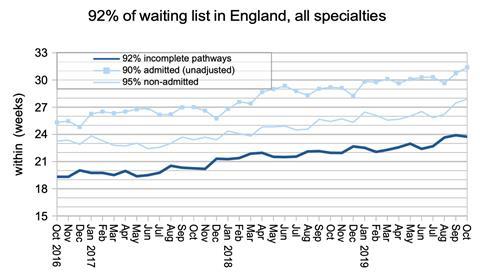
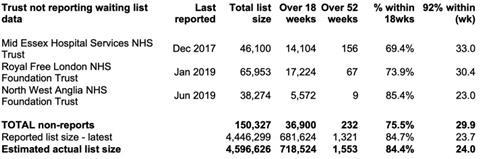
The list of non-reporting trusts did not change. After adding their last known positions back in, 92 per cent of the waiting list extended out to 24 weeks compared with the target of 18 weeks.
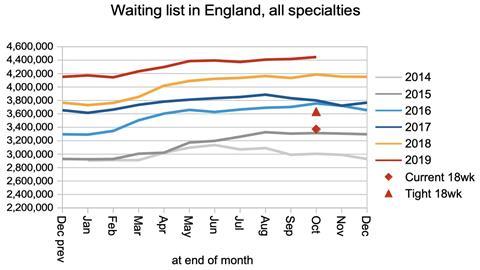
Turning to the reported size of the waiting list, it is worth remembering that it did not always follow the seasonal pattern shown in the chart below (rising in the spring, flatlining in the autumn).
This post from six years ago shows a time when the English NHS was keeping up with demand, and the waiting list showed the more healthy seasonal pattern by rising in the spring and falling in the autumn.
Unless the NHS can get back to that pattern, by keeping up with elective demand, waiting lists and waiting times will continue to grow year-on-year.
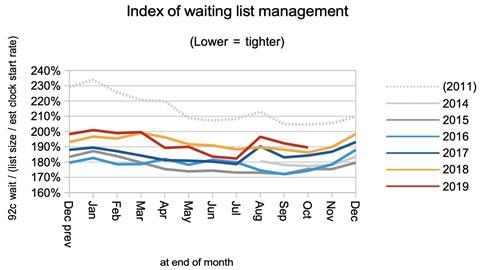
Waiting times depend on both the size and shape of the waiting list. The shape suffered a sudden and unexplained deterioration in August, from which it has not yet recovered, as shown by the index below.
As winter starts to bite, we can expect the usual seasonal deterioration in the waiting list shape to kick in, causing a rise in waiting times.
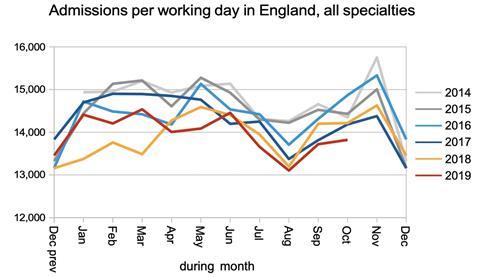
The English NHS is struggling to admit elective inpatients and daycases, and this is consistent with the dreadful waiting times being seen in type 1 (major) accident and emergency departments and serious pressures on hospital capacity with bed occupancy reaching an excessive 95 per cent.
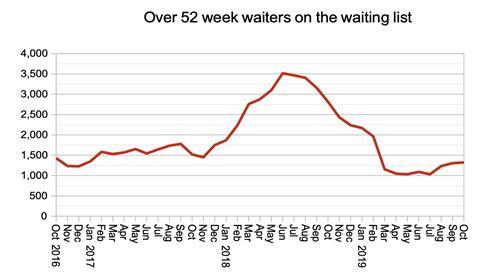
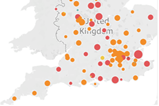
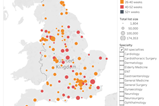
The number of one-year waiters on the waiting list is still creeping up. These ultra long waits are concentrated in a small proportion of local services (specialties within trusts), with just 13 local services accounting for half of them.
One-year waiters are not yet inevitable, given the size of the national waiting list, and there is rightly a renewed focus on these exceptional waits this year. But if the waiting list continues to grow, then the pressure on one-year waiting times will inevitably grow too.
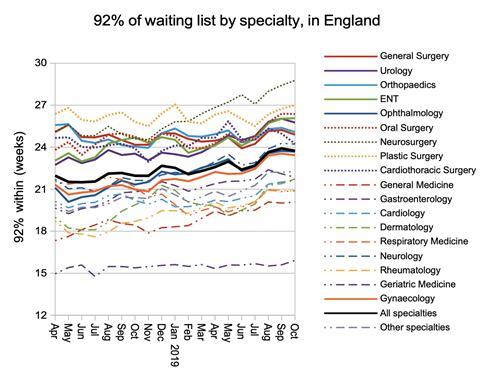
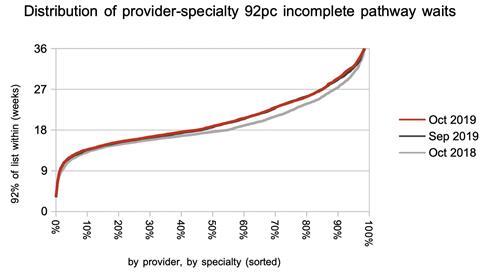
There was a mixed picture at specialty level in October, with waiting times reducing even in some inpatient-heavy services (like orthopaedics) while rising in others.
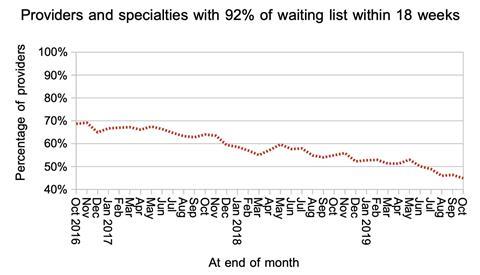
The proportion of local services achieving the 18-week target shrank again to 45 per cent.
The distribution of waiting times was virtually unchanged over the month.
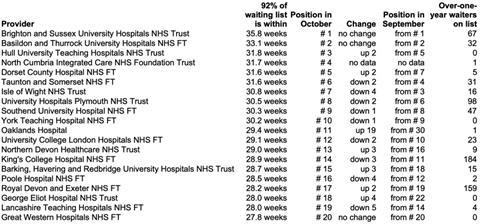
There was little movement in the top 20 during October. North Cumbria Integrated Care Foundation Trust was formed by merging Cumbria Partnership FT and North Cumbria University Hospitals Trust, and the latter previously occupied second place in the table.
Referral-to-treatment data for November is due out at 9:30am on Thursday 9th January 2020 (with data revisions for April to September 2019).
Downloads
RTT waiting times fact checker
Excel, Size 0.17 mb


1 Readers' comment