


In spite of record pressures on A&E waiting times, the English NHS managed to have a fairly normal January for elective care.
There was no blanket shutdown in elective surgery this winter, and (despite record pressures in A&E) the English NHS pulled out the stops to admit long-waiting patients after the Christmas break. Their efforts were rewarded by a small pause in the deterioration of elective waits.
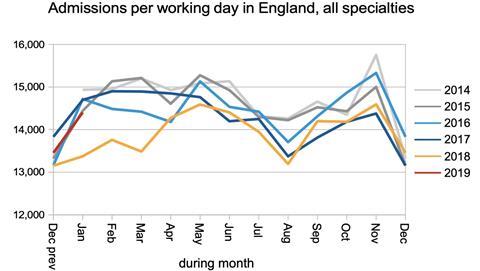
Why the underwhelming result? Although the admission rate was much higher this January than last, it was still on the low side for recent years and not enough to make a serious dent in the waiting list. And the shape of the waiting list is continuing to slip which puts upward pressure on waiting times.
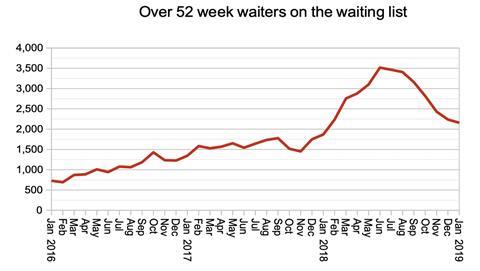
There was a bit of good news in the figures though, as the number of one year waiters continued to fall. But the improvement was smaller than in recent months.
In the following discussion, all figures come from NHS England. If you have a national statistic that you’d like to check up on, you can download our RTT waiting times fact checker.
England-wide picture
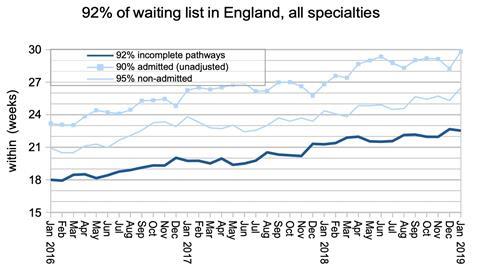
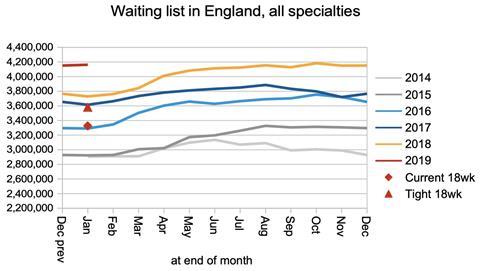
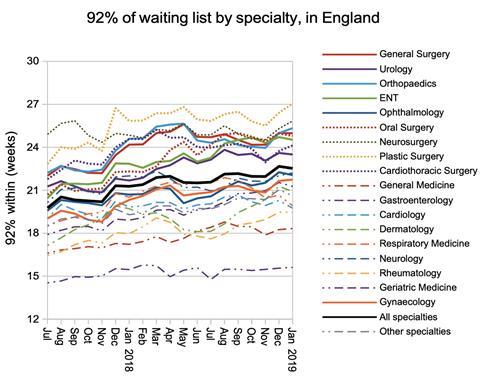
The NHS devoted its efforts to treating the longest-waiting patients in January, and partially reversed the increase in waiting times seen in December. Waiting times remain well beyond the 18 week “incomplete pathways” standard at over 22 weeks.
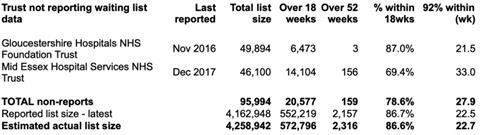
St George’s University Hospitals Foundation Trust started reporting (most of) its elective waiting times data again, adding some 29,000 patients to the reported waiting list and turning the seasonal shrinkage in the national waiting list into apparent growth. Their return leaves only two trusts on the official list of non-reporters.
Returning to the reported figures, as noted above the small apparent growth in the reported waiting list is an artefact of counting changes. On an adjusted basis the waiting list shrank slightly during January, as it often does at this time of year.
Nevertheless the waiting list is still growing rapidly year-on-year, and this is the main underlying cause of lengthening waiting times.
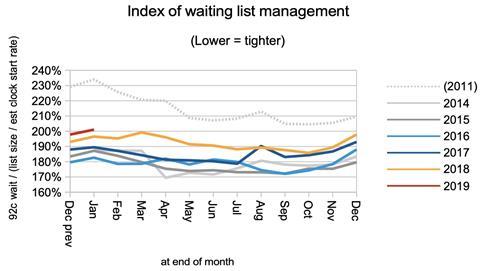
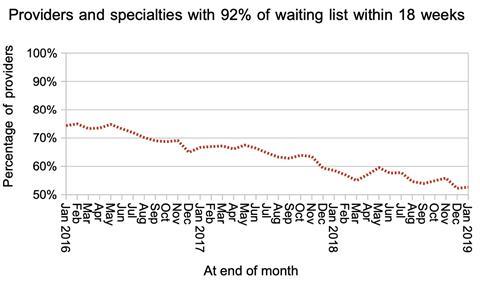
The other drivers of waiting times are bundled up in the index of waiting list management below, which reflects the spread of waiting times across different specialties and providers, as well as the NHS’s accuracy at treating routine patients on a first come, first served basis.
This index deteriorated sharply in August 2017, and again in December 2018, but is still better than it was before the current incomplete pathways target was introduced in 2012.
The admission rate was normal for a January, and much better than during last year’s cold winter and elective shutdown.
The good news was that one year waiters continued to come down, albeit at a slower rate than in recent months. This important measure looks to end the financial year better than it started it, but the ambition to halve it is out of reach.
Some specialties got better and some worse at national level. Of the big surgical specialties, orthopaedics stands out for its long and lengthening waiting times, and for having some 27 per cent of the nation’s one year waiters.
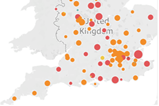
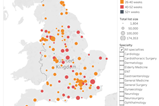
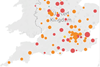
Local detail
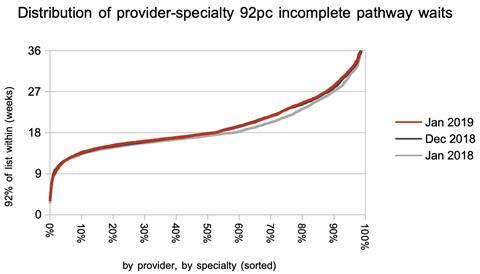
Looking locally at the 2,500-odd specialties within providers, both the proportion and distribution of local waiting times remained essentially unchanged in January.
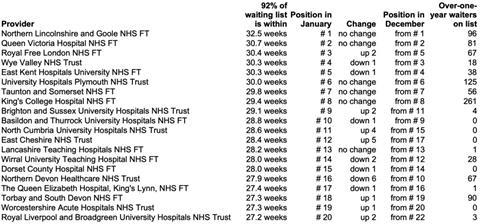
There was also little movement in the table of longest-waiting providers, although waiting times at the top of the table did improve slightly during January.
Referral-to-treatment data for February 2019 is due out at 9:30am on Thursday 11th April. Happy year end, everyone.
Dr Rob Findlay is director of software company Gooroo Ltd,


No comments yet