


The English NHS achieved its important ambition to halve the number of one-year waiters during 2018-19. However, the underlying waiting list continued to grow, reaching record levels and frustrating the other main ambition for elective waits. By Rob Findlay
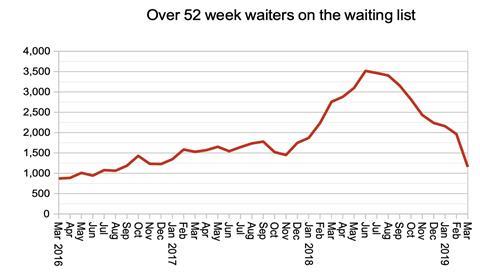
The English NHS triumphed in its ambition to halve the number of patients waiting longer than 52 weeks during 2018-19, thanks to a late surge that reduced numbers to their lowest level since August 2016.
But it was bad news for the other elective ambition: to stop the waiting list from growing overall. Not only did it grow substantially during 2018-19, but during March it broke the record to become the largest referral to treatment waiting list ever reported (the previous record having been set back in August 2007 when data was collected for the first time).
In the following discussion, all figures come from NHS England and NHS Improvement. If you have a national statistic that you’d like to check up on, you can download our RTT waiting times fact checker.
England-wide picture
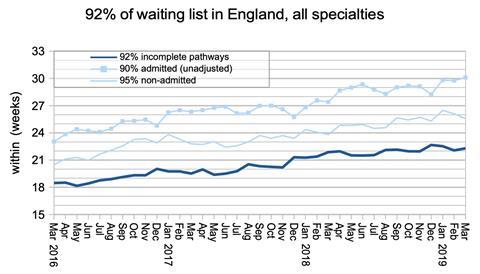
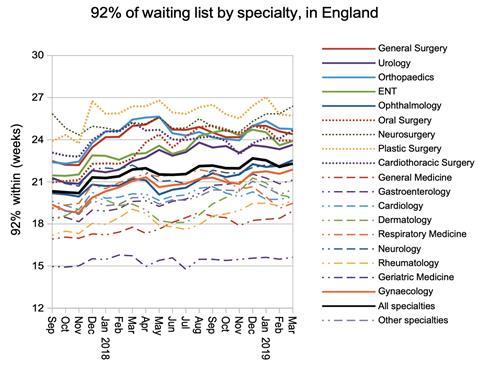
Waiting times continued to hover around the 22 week mark as the financial year came to an end.
If you are watching this year’s trials of average waiting times, then you may be wondering how the current and trial waiting times measures correspond to each other – and it turns out you can convert from the current 92 per cent waits to average waits simply by dividing by 2.3. So the latest 22 week performance is equivalent to an average wait of 10 weeks, and the 18-week target corresponds to an average waiting time target of eight weeks.
Only two trusts are listed as not reporting RTT data, now that Gloucestershire Hospitals Foundation Trust has resumed with a waiting list 6,639 patients bigger than it left with in November 2016.
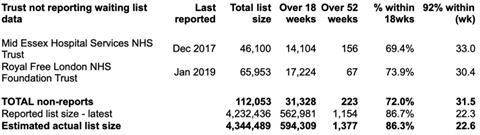
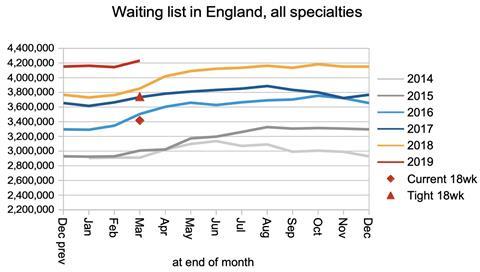
Returning to the reported data, until recently the first ever RTT waiting list was also the biggest: back in August 2007 there were 4,186,974 patients on the waiting list and that level has been unbeaten. Until now: at the end of March 2019, 4,232,436 patients were reported on the waiting list. But that data is of course confounded by non-reporting trusts who don’t appear in the figures, and if you add them back in then the record was actually broken nearly a year ago.
The waiting list data charted below is based on the reported figures (without adjustment for non-reporting trusts), and the sharp rise in March 2019 is partly caused by Gloucestershire Hospitals FT returning to the data series. But the waiting list grew by some 38,000 patients even after non-reporting trusts are factored in, so much of the growth was real.
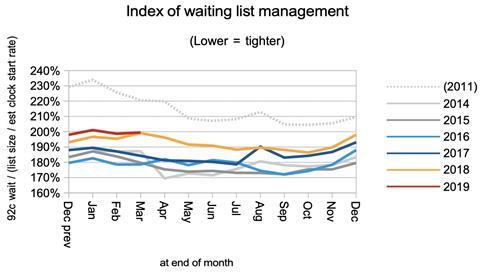
The index of waiting list management, which bundles up all the drivers of long waiting times other than list size, converged on the 2018 value which is a nice bit of good news. This goes hand in hand with the reduction in one year waits and represents a welcome tightening of waiting list management (albeit still much looser than before 2017).
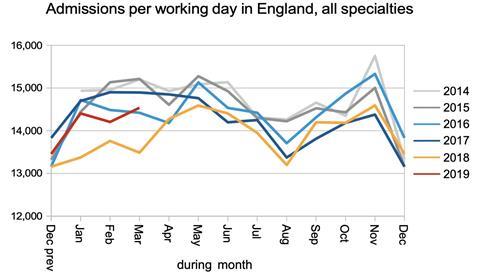
Admissions per working day continued to beat last year’s exceptionally low performance, but fell short of the levels typical of other recent years.
The big success story of the month was one-year waits, which were successfully halved during 2018-19 after an unpromising increase in the first quarter. NHS England and NHS Improvement’s statisticians have done a careful analysis of this, based on both the reported figures and looking only at trusts who reported at the start and the end of the financial year. To cut a long story short, one-year waiters were better than halved either way.
The specialty level picture has been mixed in recent months.
Local detail
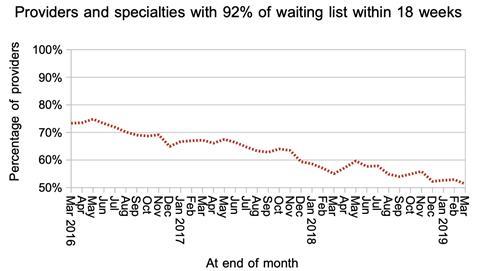
The proportion of local services (by trust, by specialty) achieving the 18 week target eased down again slightly, and barely more than half of local services are achieving the target.
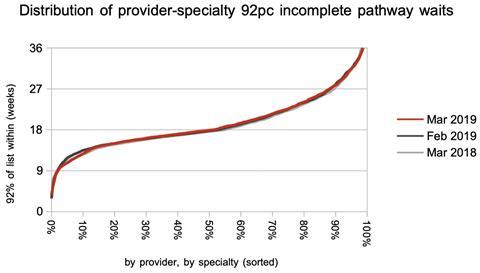
The distribution of waiting times was little changed month on month.
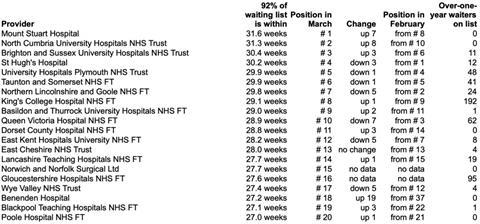
Waiting times have been rising fairly rapidly at North Cumbria University Hospitals Trust in recent months, and the latest rise takes them from 29.1 weeks (the 10th longest in England) in February, to 31.3 weeks (2nd longest) at the end of March.
A couple of new independent sector providers have entered the table, which may reflect overspill from neighbouring NHS trusts with long waiting time pressures.
Referral-to-treatment data for April is due out at 9:30am on Thursday 13 June.
Dr Rob Findlay is director of software company Gooroo Ltd,


No comments yet