


English waiting times will continue to grow, indefinitely, until the NHS gets closer to keeping up with demand. By Rob Findlay
NHS England’s and NHS Improvement’s planning guidance for 2018–19 no longer required trusts to meet the 18-week target for elective care. We were concerned that this could imply to local health bodies that these targets are no longer important.
Recommendation: NHS England should set out, by December 2019, how, and by when, it will ensure that waiting times standards for elective and cancer care will be delivered again.
House of Commons, Public Accounts Committee, 12 June 2019
In their report of 12th June, the Public Accounts Committee gave a fairly heavy mauling to the government’s waiting times policy. And with good reason, as figures just released for April 2019 show.
Waiting times are well over 22 weeks in England, while the legislation promises 18 weeks, and the best recorded performance was below 16 weeks.
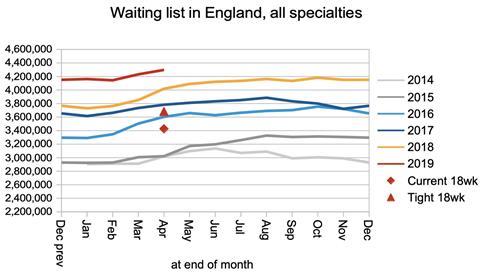
Some 4.3 million people are on elective waiting lists, which is the largest number ever recorded, and approaching double the smallest ever list size.
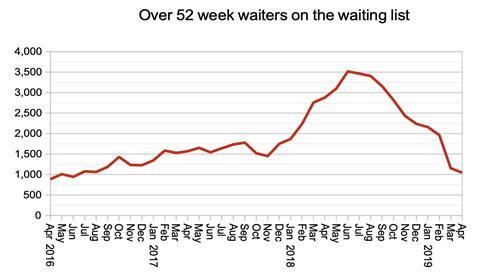
There are 1,047 over 52-week waiters, compared with a “zero tolerance” target of none at all, and nearly five times the smallest number ever recorded. (Though this number, at least, is currently heading in the right direction.)
Rising elective waiting times are mainly propelled by the rapidly growing waiting list, which has risen 5.1 per cent year on year. And the waiting list is growing so rapidly because the NHS is not nearly keeping up with demand. Until that changes, waiting times will continue to grow, and any attempt to achieve “success” by shifting the standard is doomed because any new level will eventually be breached.
Amid the gloom there was a lighter moment at the end of the PAC’s oral evidence session. So here for your enjoyment are the outgoing comptroller and auditor general and the chief executive of NHS England saying their fond farewells in true Yes Minister style:
Sir Amyas Morse: I have very much enjoyed the creative testimony I have heard from the Health team.
Simon Stevens: We feel it is entirely consistent with the degree of objectivity in the judgments from the NAO.
Chair: I think that is a very low blow, if I may say so, Mr Stevens. The NAO has our full support under the current comptroller and auditor general, and his successor.
Public Accounts Committee, 24 April 2019
In the following discussion, all figures come from NHS England and NHS Improvement. If you have a national statistic that you’d like to check up on, you can download our RTT waiting times fact checker.
England-wide picture
Waiting times edged up again after the winter lull, with 92 per cent of incomplete pathways extending out to 22.6 weeks at the end of April.
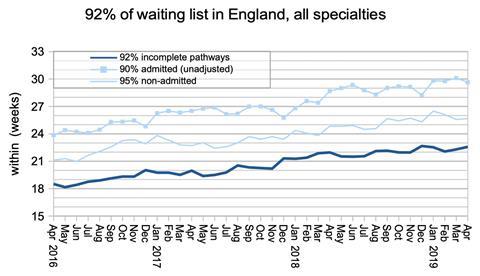
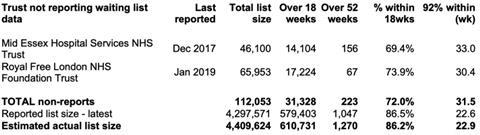
There was no change to the list of non-reporting trusts, and if you add in their last known positions then the referral to treatment waiting list has topped 4.4 million people for the first time, with waiting times extending to 22.9 weeks.
The rise in waiting times was driven by growth in the numbers of patients waiting.
Based on the current shape of the national waiting list, the list would need to shrink by 870,000 patients before 18 weeks could be achieved again (or by 620,000 if the NHS could also regain the better shape that was seen from 2013-16).
Talking of better waiting list shapes: it has abruptly improved, as the index of waiting list management below shows. This index gathers up all the drivers of long waiting times other than the size of the waiting list, and in April it suddenly closed some of the gap between recent performance and that of a few years ago.
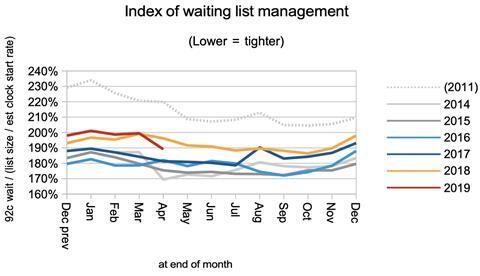
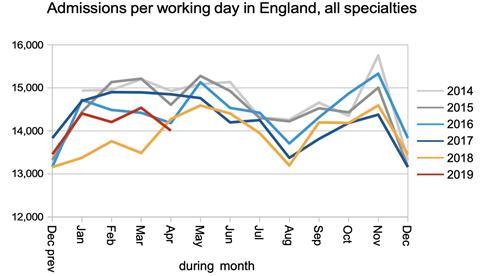
Admissions per working day were exceptionally low in April, which is partly because of the late Easter and late school holidays. But then Easter was late in 2014 too, when activity held up pretty well, so the underlying capacity squeeze should probably take the lion’s share of the blame.
The number of one-year waiters continued to fall, having achieved last year’s target that numbers should halve. This is excellent news, and the Department for Health and Social Care and NHS England are right to continue to focus on it, because of the risk of harm to routine patients who are excessively delayed.
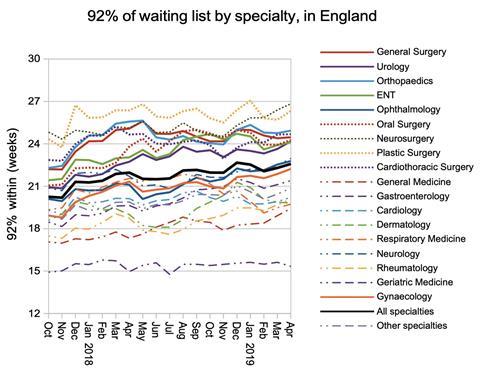
Nearly all specialties saw rising waiting times in April, with the exception of Geriatric Medicine which is also the only specialty achieving 18 weeks at national level.
Local detail
The proportion of local services (by specialty by trust) achieving 18 weeks plateaued in April, hovering just above the 50 per cent mark.
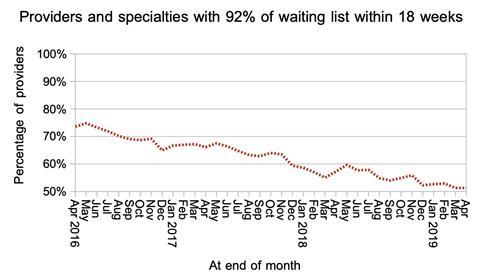
There was an improvement in short-waiting local services in April, and a slight deterioration in longer-waiting ones. Over the year, though, the main change has been in the middle with more specialties breaching 18 weeks than before.
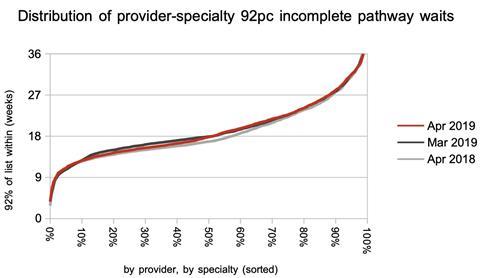
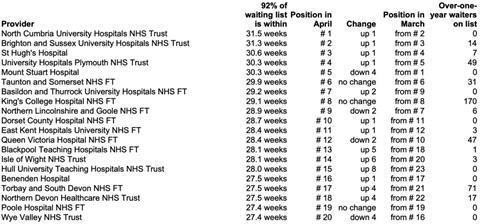
There was little change in the list of top 20 longest-waiting providers.
Referral-to-treatment data for May is due out at 9:30am on Thursday, 11th July, together with revisions for October 2018 to March 2019.
Dr Rob Findlay is director of software company Gooroo Ltd,


2 Readers' comments