


Waiting times rose again, and the longest waits were hardest hit. Continued, severe and widespread capacity pressures are the likely culprit. By Rob Findlay
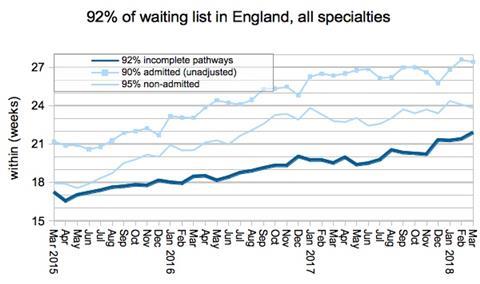
Referral to treatment waiting times rose to 22 weeks during March. This is the longest waiting time since March 2009; it is nearly two and a half weeks longer than in March last year; and it is of course far worse than the NHS Constitution right to treatment within 18 weeks of referral.
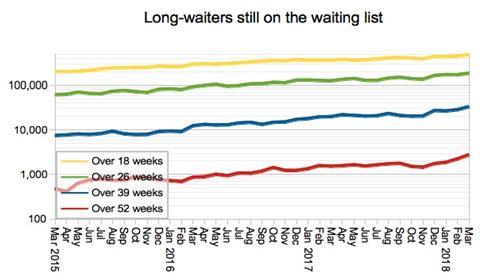
Ultra long waits rose even faster, with the reported number of one year waiters shooting up 23 per cent in a single month.
It is difficult to tell exactly what caused this, because so many indicators took a turn for the worse during March. But several lines of evidence point to continued severe pressure on hospital capacity (particularly beds) being the root cause. They are:
- continued low admission rates,
- rising waits particularly in big inpatient specialties,
- unusually high “last minute” cancellation rates, and
- exceptionally long accident and emergency waiting times in March.
In the following discussion, all figures come from NHS England. If you have a national statistic that you’d like to check up on, you can download our RTT waiting times fact checker.
England-wide picture
You have to go back to March 2009, when the last Labour government was about to achieve the 18 week standard properly for the first time, to find longer waiting times than these.
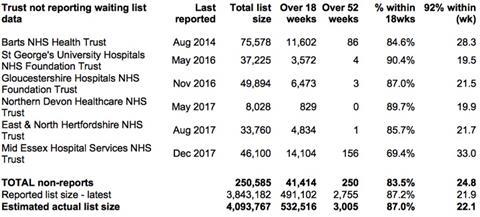
Back then, there were only 2.4 million patients on the waiting list. Now there are 4.1 million (if you adjust for non-reporting trusts), which is very close to the record of 4.2 million patients which was set when records began back in August 2007.
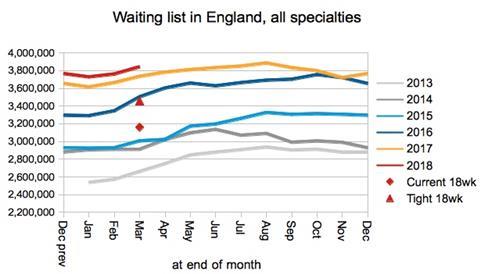
The waiting list grew in March 2018 by a typical amount for the time of year. This will certainly have added to the waiting list pressures, but as we shall see this is not the end of the story.
The size of the March waiting is significant for another reason too, because it becomes the target list size for March 2019. Some of you might uncharitably wonder whether, if the NHS managed to artificially inflate the waiting list now, that might somehow make the target easier to achieve next year. This is not the case: keeping a steady waiting list means keeping up with demand, whatever the list size. Having said that, the NHS could have made life easier by lightening the casemix on the waiting list, by treating predominantly heavy cases during March; however the numbers suggest that actually the reverse happened.
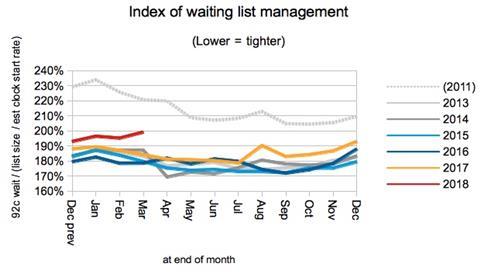
Moving on to the next chart we find that waiting list management slipped again, which is what you would expect when there are exceptionally long waits in A&E and cancellations are running at a high rate, disrupting elective admissions.
I wrote recently that this index of waiting list management might also be affected by perverse incentives, arising from the approaching targets around waiting list size. Might this have affected the figures? There is no way to rule it out, but I think that capacity pressures are a sufficient explanation and there is no need to invoke a target that hadn’t actually kicked in yet.
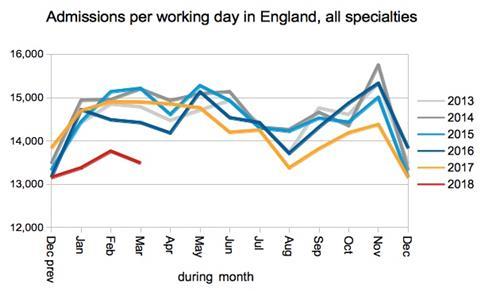
Admissions remained very low for March, which is consistent with severe capacity pressures squeezing out elective activity. It is also consistent with the unusually high cancellation rate. Non-admitted clock stops (not shown) were close to the previous year’s levels throughout the winter, suggesting they were not badly affected which again is consistent with bed pressures being the main cause.
The number of patients waiting over 52 weeks shot up from 2,236 to 2,755 on the reported figures (2,486 to 3,005 if you add in the last reported positions at non-reporting trusts). Either way, that is more than 20 per cent which is quite a hike in a single month. The current number of one year waiters is more than 10 times the lowest figure ever reported (214 in November 2013), and the highest since July 2012.
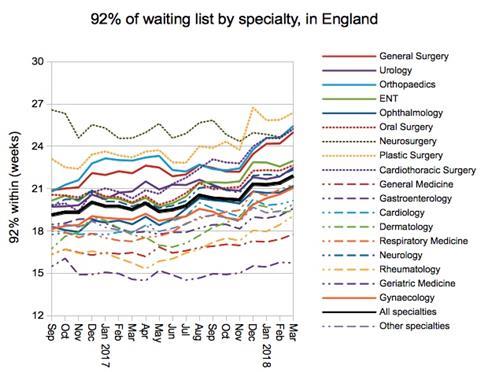
At specialty level, the biggest increases in waiting times over winter (December to March) were seen in orthopaedics (up 1.7 weeks), general surgery (up 1.5 weeks) and cardiothoracic surgery (up 1.2 weeks), all of which had 25 week waits to start with and form a fairly obvious bunch in the chart below. The other thing they have in common is that they’re heavy on inpatients, which again is consistent with difficulties in admitting inpatients because the beds are full of winter emergencies.
Local detail
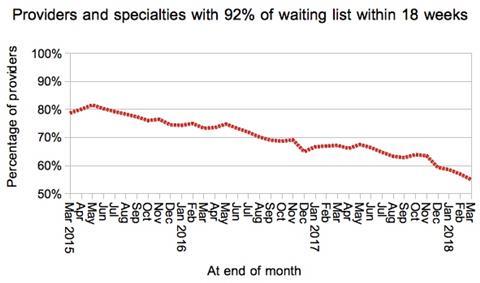
The proportion of local services (specialties within trusts) achieving the 18 week standard slipped again to just 55 per cent.
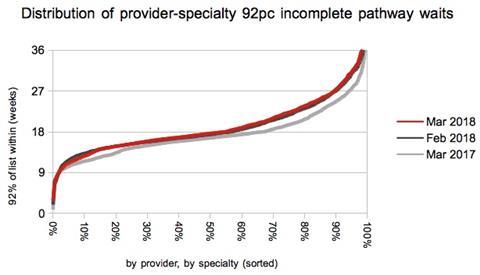
The increase in waiting times was predominantly at the longer waiting end of the spectrum again, which is consistent with heavy casemix services being the hardest hit.
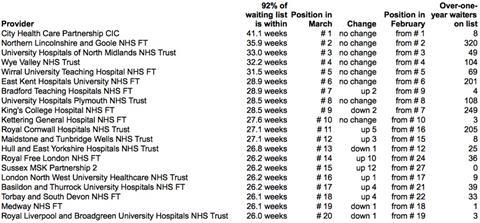
Turning to the top 20 longest waiting trusts, the rising tide has lifted all boats. A trust now needs to have waits over 26 weeks even to appear on the table.
RTT data for April is due out on 14 June.
Rob Findlay is director of the software company Gooroo,


Topics
- Acute care
- BARTS HEALTH TRUST
- BASILDON AND THURROCK UNIVERSITY HOSPITALS NHS FOUNDATION TRUST
- BRADFORD TEACHING HOSPITALS NHS FOUNDATION TRUST
- EAST AND NORTH HERTFORDSHIRE NHS TRUST
- EAST KENT HOSPITALS UNIVERSITY NHS FOUNDATION TRUST
- GLOUCESTERSHIRE HOSPITALS NHS FOUNDATION TRUST
- HULL AND EAST YORKSHIRE HOSPITALS NHS TRUST
- KETTERING GENERAL HOSPITAL NHS FOUNDATION TRUST
- KING'S COLLEGE HOSPITAL NHS FT
- London North West University Healthcare NHS Trust
- MAIDSTONE AND TUNBRIDGE WELLS NHS TRUST
- MEDWAY NHS FOUNDATION TRUST
- MID ESSEX HOSPITAL SERVICES NHS TRUST
- NHS England (Commissioning Board)
- NORTHERN DEVON HEALTHCARE NHS TRUST
- NORTHERN LINCOLNSHIRE AND GOOLE NHS FOUNDATION TRUST
- Quality and performance
- ROYAL CORNWALL HOSPITALS NHS TRUST
- Royal Free London NHS Foundation Trust
- ROYAL LIVERPOOL AND BROADGREEN UNIVERSITY HOSPITALS NHS TRUST
- Specialist care
- St George’s University Hospitals NHS Foundation Trust
- Torbay and South Devon NHS Foundation Trust
- UNIVERSITY HOSPITALS OF NORTH MIDLANDS NHS TRUST
- University Hospitals Plymouth NHS Trust
- Waiting lists
- WIRRAL UNIVERSITY HOSPITAL NHS TRUST
- WYE VALLEY NHS TRUST


No comments yet