


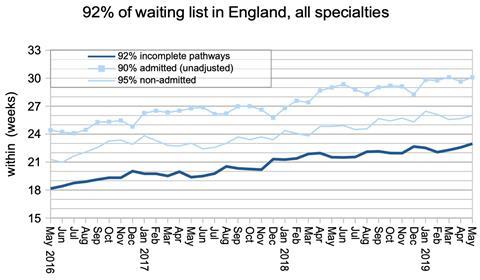
Elective waiting times have risen from 22 weeks to 23 weeks over the last 14 months, and there is still no end in sight. The target, of course, is just 18 weeks.
The NHS Constitution gives patients the right to treatment within 18 weeks of referral, and regulations require 92 per cent of the waiting list to fall within that time. But this “18 weeks” target has not been achieved since February 2016.
Since then things have steadily got worse. Just over a year ago, waiting times reached 22 weeks. And in the latest figures (for May) they reached 23 weeks.
Is there a natural level at which referral to treatment waiting times will stop growing? No. They will continue to grow, without limit, for as long as the NHS is unable to nearly keep up with elective demand.
Which is why the faltering admission rate is so important: if capacity is so congested that the NHS cannot admit enough elective patients, then recovery will remain out of reach and no target - not even 52 weeks - is safe.
In the following discussion, all figures come from NHS England and NHS Improvement. If you have a national statistic that you’d like to check up on, you can download our RTT waiting times fact checker
England-wide picture
For the first time since March 2009, 8 per cent of the waiting list had waited longer than 23 weeks.
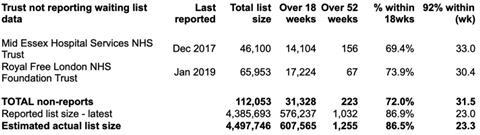
If you add the last reported positions at the two non-reporting trusts back in, then the waiting list was a whisker away from 4.5 million patients.
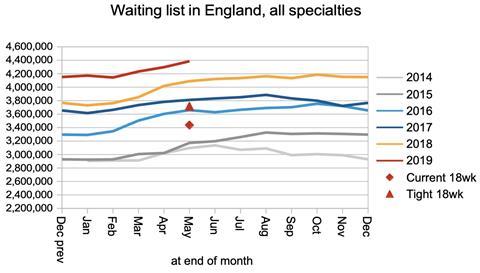
The waiting list has grown so big that three years of growth would need to be reversed before “18 weeks” became achievable again.
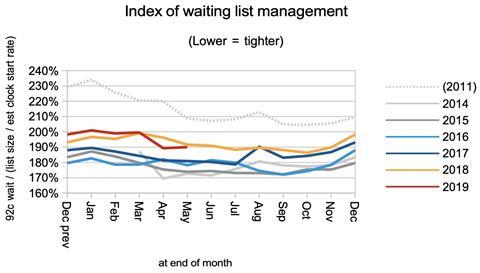
The index of waiting list management, which bundles up all the influences on waiting times apart from the size of the waiting list, remains at the elevated (ie worse) levels seen since August 2017.
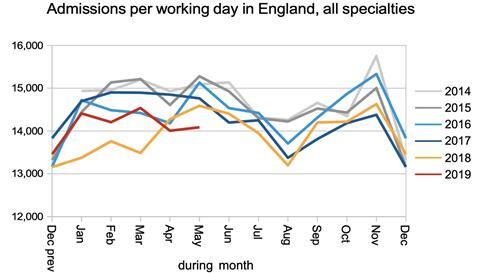
The rate that patients were admitted from the RTT waiting list – as inpatients or daycases – faltered. Since the start of this financial year, the admission rate has been lower than even a typical January or February. This is likely to reflect continuing severe pressures on NHS capacity, particularly beds.
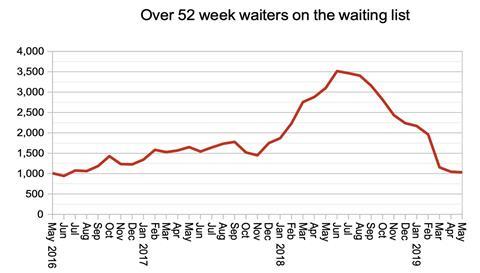
Amidst the gloom, it is good to see 52-week waits continuing to come down. However if baseline activity continues to fall well short of demand, it is only a matter of time before this measure comes under renewed pressure. When that happens, “waiting list initiatives” will no longer have lasting results because the underlying growth in the waiting list will soon overcome any temporary improvement.
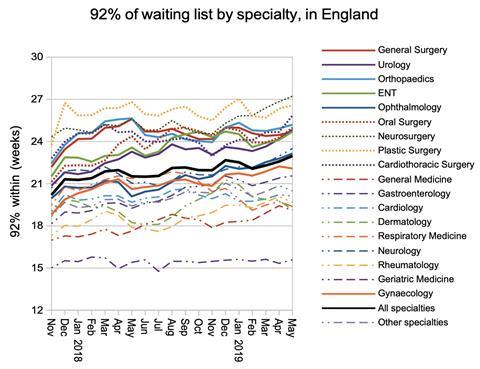
The growth in overall waiting times was broadly reflected at specialty level.
Local detail
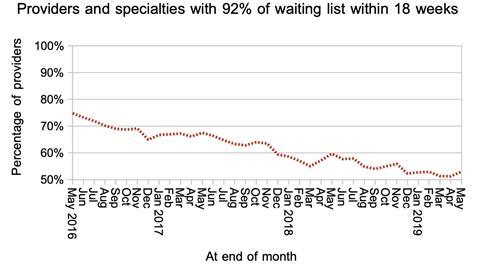
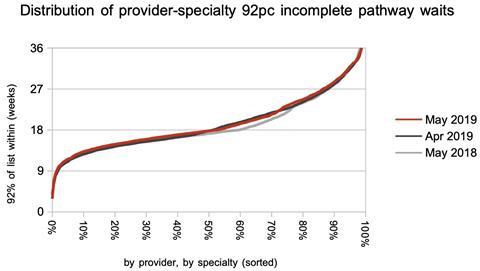
The proportion of local services (by provider, by specialty) achieving “18 weeks” continues to hover just above the 50 per cent mark.
The distribution of those waiting times changed only slightly, as waiting times broadly converged on 18 weeks.
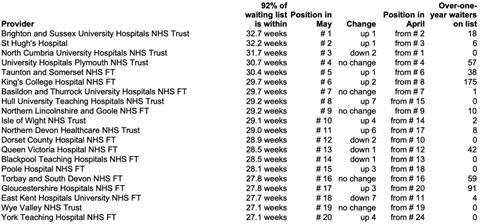
The top 20 longest-waiting providers saw two trusts (Hull University Teaching Hospitals Trust and Northern Devon Healthcare Trust) rising up the table with lengthening waiting times, and East Kent Hospitals University Foundation Trust drop seven places as waits shortened.
Referral-to-treatment data for June is due out at 9:30am on Thursday 8th August.


2 Readers' comments