


Waiting times didn’t get significantly worse in September, and some indicators improved. But it’s still going to be tough to stop the waiting list from growing this financial year. By Rob Findlay
The English waiting list shrank slightly in September as elective admissions picked up after the summer holidays. Waiting times were broadly steady, and the number of one year waiters edged down.
All of that is encouraging. But it is also worth noting that the waiting list is still much longer than it was a year ago, and this is putting continued pressure on waiting times.
As winter approaches and bed pressures remain high, it is doubtful whether the ambition to hold the waiting list steady across the financial year can now be achieved.
In the following discussion, all figures come from NHS England. If you have a national statistic that you’d like to check up on, you can download our RTT waiting times fact checker.
England-wide picture
Waiting times edged slightly higher from 22.1 to 22.2 weeks during September, on the basis of how long 92 per cent of incomplete pathways had waited at month end.
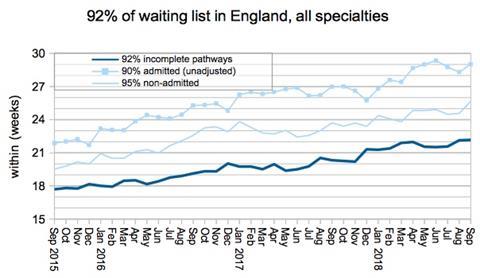
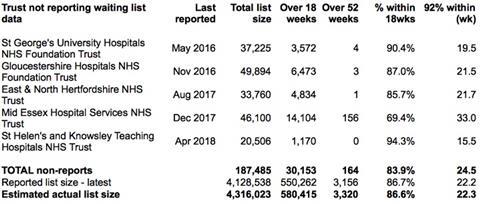
If the last known positions at non-reporting trusts are added back in, that waiting time is slightly higher again at 22.3 weeks. The list of non-reporting trusts was unchanged during September.
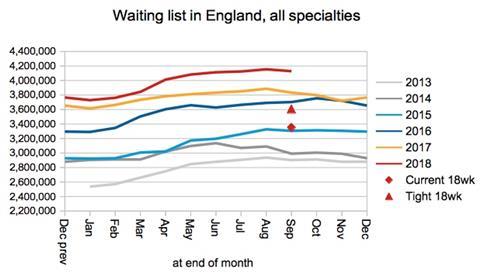
Returning to the reported data, the gap between the latest waiting list and the corresponding figure from the year before continues to widen.
The list is now so large that between two and three years of waiting list growth would need to be reversed before the 18 week standard became achievable again, depending on how optimistic you feel about improving the shape of the waiting list.
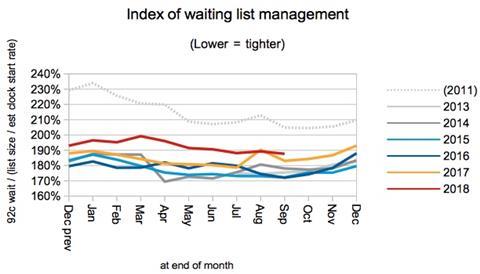
The shape of the waiting list, represented below by an index of waiting list management, sweeps up all the drivers of waiting times other than those related to the size of the waiting list.
This index improved rapidly when the incomplete pathways target was introduced in 2012, and remained good for several years thereafter. Last August it suddenly ticked upwards (I don’t know why, but would speculate that it may be connected to rising bed pressures), and has remained at the higher (ie worse) level ever since.
What is slightly worrying is that the latest index is worse than last September’s performance, which is not encouraging for waiting times as winter approaches.
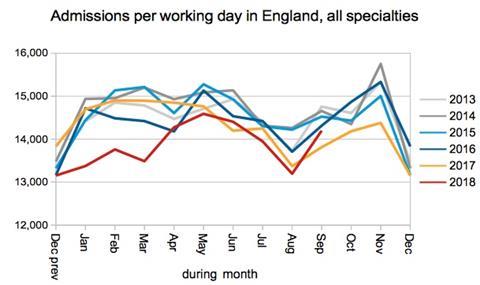
The inpatient and daycase admission rate per working day has been in the doldrums all year following a dreadful winter, but in September it finally recovered which is good news.
Non-admitted clock stops (not shown below) also rose, but they were mirrored by a corresponding uptick in the clock start rate.
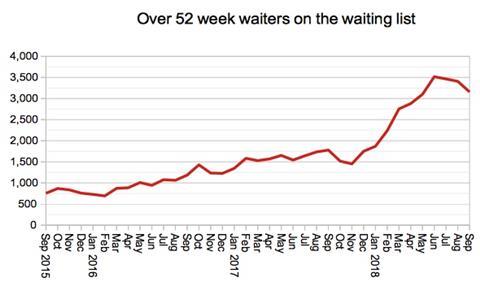
The number of one year waiters improved, in a minor reversal of the previous year’s rapid deterioration. It is supposed to halve across this financial year to 1,378.
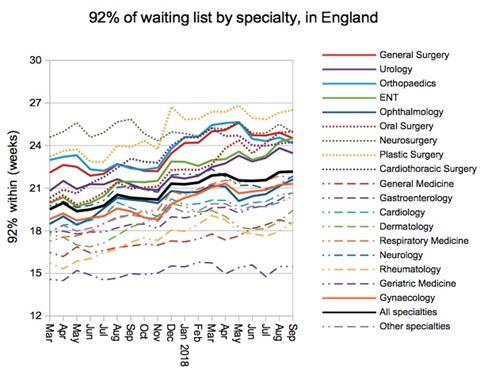
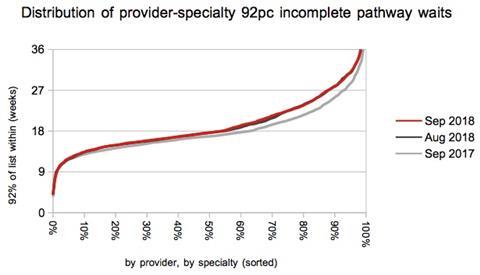
At specialty level there was a broad convergence of waiting times towards the average, as the longest waiting specialties improved slightly and the shortest-waiting specialties deteriorated.
Rheumatology waiting times jumped from 17.9 to 18.6 weeks, leaving only one specialty – Geriatric Medicine – achieving the 18 week standard at national level.
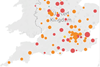
Local detail
The proportion of local services achieving the 18 week standard fell again, from 54.6 per cent to 53.9 per cent. So only a slender majority of local services are now achieving “18 weeks”.
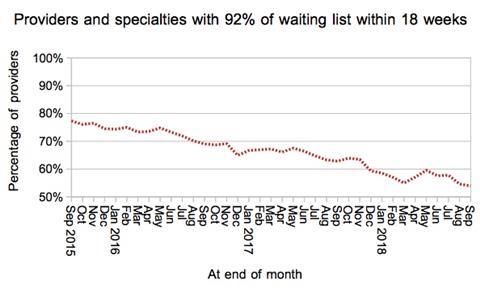
The deterioration was focused in those services that are narrowly breaching the standard.
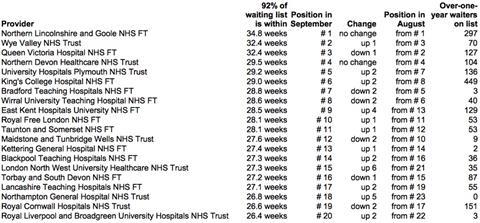
Northern Lincolnshire and Goole Foundation Trust are the longest waiting provider for the fourth month running, although their waiting times have eased back slightly in that time from 35.6 weeks to 34.8 weeks.
Near the bottom of the table, Northampton General Hospital Trust are a new entrant, having risen five places, with waiting times up from 26.3 weeks to 26.8 weeks during September.
Referral-to-treatment data for October 2018 is due out at 9:30am on Thursday, 13th December.
Dr Rob Findlay is director of software company Gooroo Ltd,


2 Readers' comments