


Waiting times are creeping up as waiting list management processes wither
It is nearly three years since financial penalties were lifted retroactively from referral-to-treatment waiting times breaches and the relentless focus on waiting times was lost. At the time, I said: “I would also expect [the waiting list shape] to be quite sensitive to the level of importance attached to RTT waiting times… a rise in this index might be the first clear sign.”
Eighteen weeks later, in the August 2017 RTT statistics, it became clear that this was indeed happening. And for three years, it has continued.
As a result, waiting times today are much longer than they need to be. The gap between the longest and shortest waits continues to grow. Heavy-casemix specialties are particularly affected. One year waiters are rising again. And underlying it all is the irresistible pressure of a growing waiting list.
It will take time, effort, and resources to reverse the growing waiting list, and the covid-19 epidemic won’t help. But a renewed focus on the fundamental processes for better allocation of existing resources, and on good waiting list management, would shorten the longest waiting times now.
This is the dull but worthy end of controlling waiting times. It lacks the sex appeal of changing the target, or the faux-common-sense of targeting the waiting list size. But these processes directly address the biggest RTT risks: those patients who get lost in the data, and those who are waiting the longest.
The worry, as the lack of focus on waiting times continues, is that the skills and knowledge to manage these processes are withering away.
In the following discussion, all figures come from NHS England and NHS Improvement. If you have a national statistic that you’d like to check up on, you can download our RTT waiting times fact checker.
England-wide picture
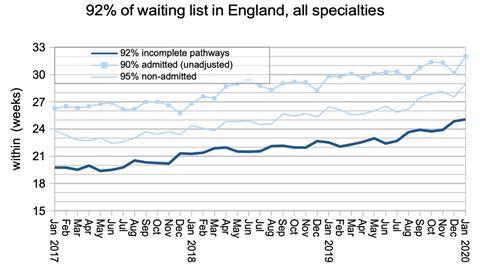
Waiting times edged up in January, but not because the waiting list grew – it didn’t. Instead there was further slippage in the shape of the waiting list. Waiting times now stand at just over 25 weeks.
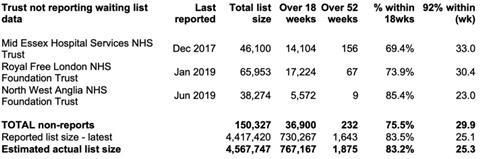
The list of non-reporting trusts was unchanged from last month, so all the data should be directly comparable with the month before.
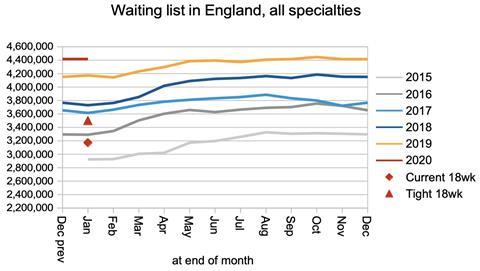
The size of the national RTT waiting list did not change during January. This is unfortunate because in a good year it would have shrunk slightly.
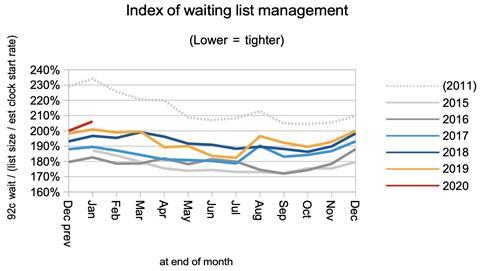
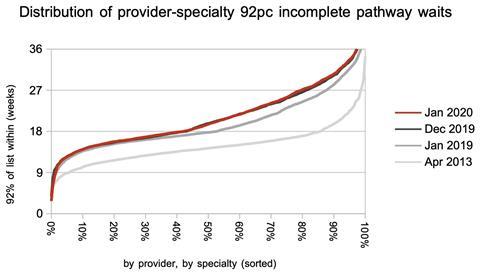
Waiting times depend on the shape as well as the size of the waiting list, and the shape is indicated by the index below. It continues to get worse.
This is driven by several things: whether patients are booked in date order within local waiting lists; how well resources are allocated within trusts to even out waiting time pressures, and how well resources are allocated between trusts. The rapidity of some of the changes in this index, the variation in waiting times between specialties, and the variations around the country suggest that slippage in all three of these processes is contributing to the deterioration.
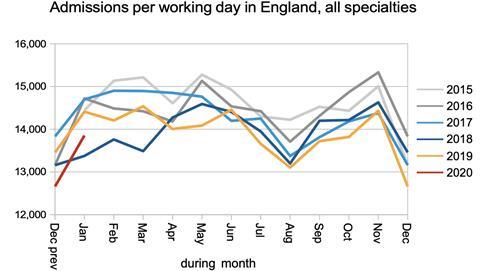
Inpatient and daycase admissions from the RTT waiting list were low again compared with recent years (albeit not quite as low as January 2018).
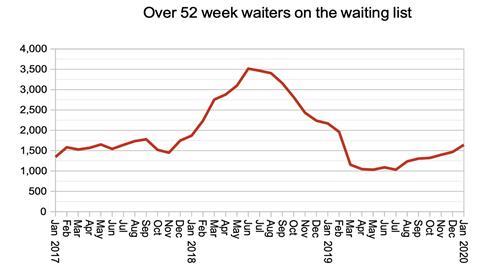
The number of one year waiters continues to creep back up again, and numbers are now higher than when financial incentives were relaxed for 18 week waits back in March 2017.
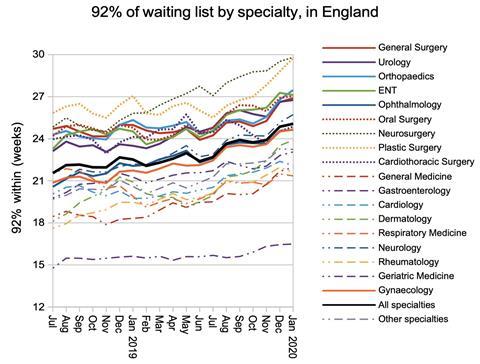
Most specialties saw an increase in waiting times in January, and the general trend for nearly all is up (with cardiothoracic surgery and geriatric medicine mostly resisting this long-term trend). Plastic surgery in particular has been rising rapidly and is on the brink of passing neurosurgery again.
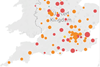
Local picture
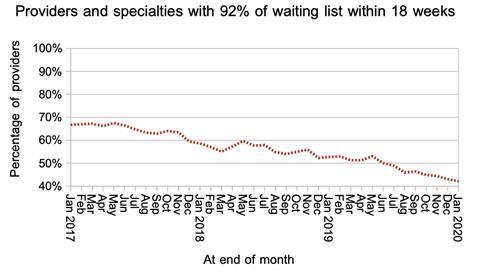
The proportion of local services (specialties within providers) achieving the 18 week target has slipped again and now stands at just 42 per cent.
The distribution of waiting times from one local service to another widened fractionally again, with the main increases being concentrated around 27 weeks.
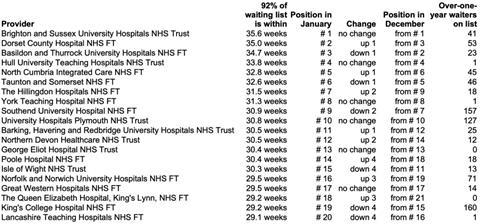
In this month’s mostly static “top 20” list of long-waiting providers, let’s take a quick look at King’s College Hospital Foundation Trust. As recently as May they had the sixth longest waiting times in England, but they have been quietly working their way down the table and now are on the point of successfully dropping off the bottom altogether. It’s easy not to notice when something like that happens, so well done them.
Referral-to-treatment data for February 2020 is due out at 9:30am on Thursday, 9th April.
Dr Rob Findlay is director of demand and capacity planning company Gooroo Ltd.


No comments yet