


Elective waiting times jumped to 25 weeks in England, as admission rates fell unusually low even for a December. By Rob Findlay
It is only four months since England’s referral-to-treatment waiting times reached 24 weeks, and now they have reached 25.
The proximate cause (as predicted last month) is the seasonal slump in the waiting list shape, exacerbated by admission rates that were exceptionally low even for a December. This comes on top of the unexplained deterioration in the waiting list shape which happened in August 2019, and led to an acceleration in waiting time growth.
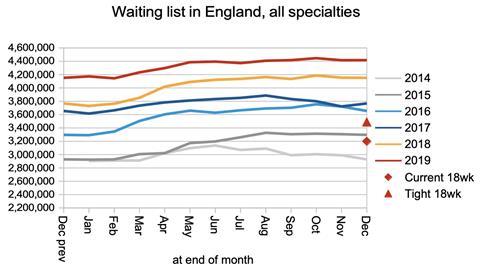
Underlying all that is the swelling waiting list, which has grown 6.6 per cent year-on-year because the NHS is not keeping up with elective demand. In the long run, this is the main driver of rising waiting times.
In the following discussion, all figures come from NHS England and NHS Improvement. If you have a national statistic that you’d like to check up on, you can download our RTT waiting times fact checker.
England-wide picture
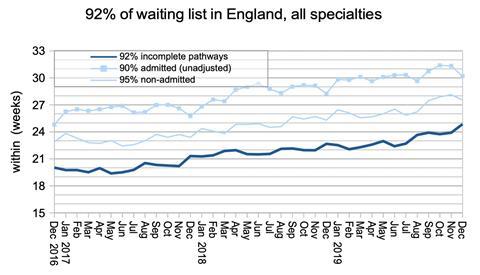
After hovering around the 24 week mark for several months, 92nd centile waiting times jumped sharply to 25 weeks in December.
This is perilously close to the 26 week threshold for offering “choice” to long-waiting patients, and means that this choice will be hollow for many patients if all their nearby providers are above 26 weeks for the specialty they need.
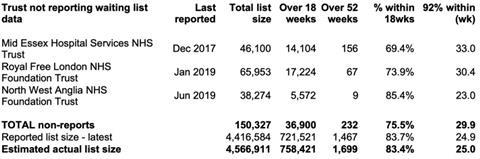
Turning briefly to the non-reporting trusts, when their last known waiting list positions are added back in, the English national waiting time is just over 25 weeks.
December’s jump in waiting times was not driven by growth in the waiting list, although that is the longer-term driver of rising waits. In December the waiting list plateaued.
This is bad because at this time of year the waiting list should be shrinking seasonally, and the fact that it isn’t suggests there will be further increases in waiting times in the coming months when seasonal growth resumes.
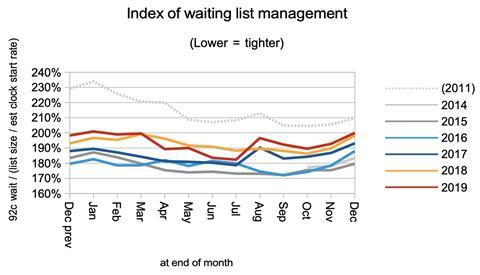
In the footer of my report last month, I said “On past form, we can expect the waiting list shape to slump, leading to an uptick in waiting times.” And so it has.
This comes on top of events back in August, when the waiting list shape deteriorated abruptly for unknown reasons and developed a longer “tail”. It remains worse than in recent years, and this has undone most of the improvement which followed the introduction of the incomplete pathways target back in 2012.
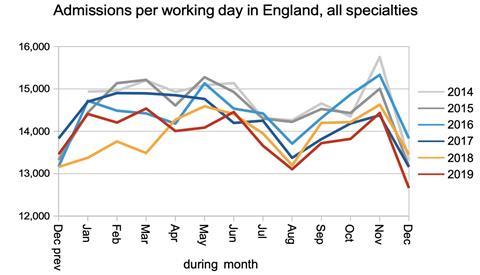
The NHS always struggles to admit elective patients in December, because emergency demand goes up and Christmas gets in the way. But even for a December this admission rate was exceptionally low.
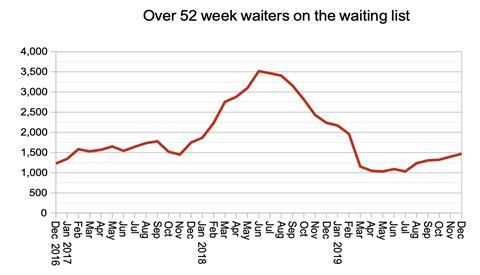
One year waiters continue to creep up.
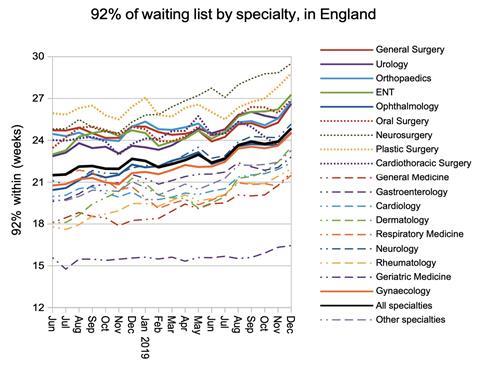
The sharp rise in waiting times affected all specialties, even those that rely mainly on daycase and outpatient facilities. Seven specialties now have longer national waiting times than the 26 week “choice” threshold: general surgery, urology, orthopaedics, ENT, oral surgery, neurosurgery and plastic surgery.
Local picture
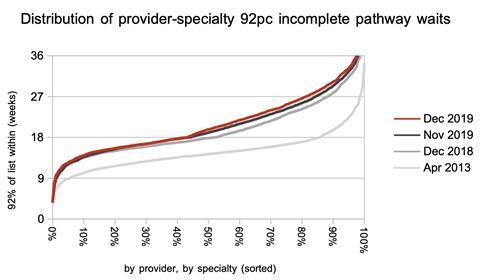
Only 43 per cent of local services (specialties within providers) are now achieving the “92 per cent of incomplete pathways within 18 weeks” target.
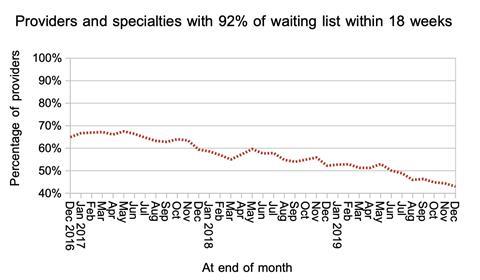
Interestingly, the sharp rise in waiting times only affects those services that are over 18 weeks. There is a remarkably sharp inflection in the distribution at the 18 week line, as services that are only just able to achieve 18 weeks cling on by their fingernails.
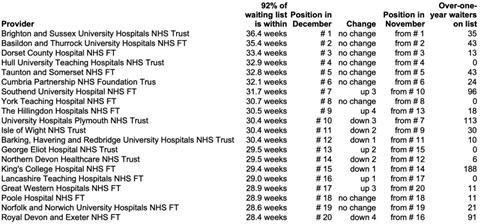
There is little change in the order when it comes to the longest-waiting providers, but the longest provider waiting time has risen from 35.7 weeks to 36.4 weeks in a single month.
Referral-to-treatment data for January 2020 is due out at 9:30am on Thursday 12th March.


No comments yet