


Sustainability issues can be so disparate that its hard to know where an organisation needs to target its efforts, but one infographic has managed to compare environmental, social and financial effects of different initiatives, finds Jennifer Trueland

Health and care organisations can become more sustainable in a number of ways, but it is a challenge to decide where focusing energies would have the biggest impact.
From waste management to encouraging staff to cycle to work, the opportunities are there to help services reduce their carbon footprint, achieve financial savings and promote health at the same time.
‘How do you compare the benefits of, say, a telehealth initiative to those of a project to improve energy awareness?’
There are pockets of great practice across the health service, says Imogen Tennison, lead analyst with the Sustainable Development Unit. But how do you compare the benefits of, say, a telehealth initiative to those of a project to improve energy awareness among staff?
And how do you assess how interventions actually perform against the three pillars of sustainable development: environmental, social and financial?
Healthy returns infographic
This was the conundrum that the SDU had been grappling with for some time, and which resulted in the healthy returns infographic.

The idea was to find initiatives that were already working on the ground, assess their impact and model what the effect would be if they were scaled up.
“What we were really looking for was areas that are ‘win-win-win’,” says Ms Tennison. “There are lots of sustainability initiatives but we wanted to see the benefits, not just in terms of environmental impact, but also the social and financial impact.”
‘We wanted to see the benefits, not just in terms of environmental impact, but also the social and financial impact’
The SDU worked with NEF Consulting to identify real life examples of good practice and calculate their potential impact, bringing together the results in the infographic, which allows for meaningful comparisons across what might look like wildly differing scenarios.
So we can see, for example, that a project to raise energy awareness among hospital staff would have a potential financial saving of £79m per year if it was implemented across the health and care sector; it would also cut carbon emissions by 451,505 tCO2e – equivalent to taking about 205,000 cars off the road for a year.
Real life activity
This, of course, is the core business of the SDU. Funded by, and accountable to, NHS England and Public Health England, the organisation’s purpose is to support the health and care system to be sustainable and low carbon.
‘We wanted to see what would happen if the projects were scaled up’
It does this in a variety of ways – including holding events to engage with sustainability professionals, and providing a host of resources to help health and care bodies embed and promote sustainable development.
The infographic is just one part of that wider effort and, indeed, the examples chosen were mined from the growing body of real life examples drawn up as a result of that activity.
“We were looking at case studies across the health and care system, doing a scour to see what was already out there that was adding real value,” says Ms Tennison. “We wanted to see what would happen if the projects were scaled up.”
Trade offs and take up
The case studies were chosen specifically because they had demonstrated real change. The methodology used in drawing up the infographic was realistic in that it did not assume 100 per cent take up when considering the potential benefits.
‘Those figures really hit me hard – you can see that this initiative would have a real benefit’
What it does provide, however, is an extra tool in the box for those wishing to build a business case for their organisation to take a particular action.
It also makes it clear where any trade offs lie: will initial financial investment pay dividends in social or environmental terms, for example?
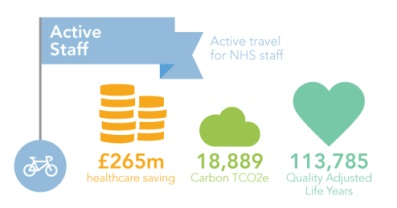
The potential impact of some initiatives is surprisingly strong, says Ms Tennison, pointing to the active staff project used on the infographic.
Based on estimates for a national NHS scheme offering active travel coaching, and assuming a 25 per cent uptake, this could save £265m, cut carbon emissions by 18,889 tCO2e and release 113,785 QALYs.
“Those figures really hit me hard – you can see that this initiative would have a real benefit,” she says. “It shows what can happen if you had a relatively limited impact on level of exercise for some staff.”
Telling a ‘story’
The beauty of the infographic, according to Ms Tennison, is that its basis in actual, real life case studies, mean it is possible to tell a story – to bring good examples to life.
This is crucial in the ongoing battle to win hearts and minds around sustainability. And the stakes are high. Like the rest of the public sector, the NHS has responsibilities under the Climate Change Act, and has committed to reducing emissions by 28 per cent between 2013 and 2020.
‘The health and care system has a real incentive to make a difference’
Early next year, the SDU will publish its report Health Check 2016 which will show if the NHS has reached its target of a 10 per cent reduction in carbon by this year.
Last year, the SDU launched a five-year sustainable development strategy for the NHS, public health and social care system – and part of that involves convincing senior managers that sustainability is in everyone’s interests.
“There’s still a long way to go,” says Ms Tennison. “But the health and care system has a real incentive to make a difference. We know that climate change has an impact on health and the health service, so it’s vital that it plays its part.”


No comments yet